Your ratings just dropped.
You are staring at the dashboard, bars, charts, and graphs, but none of them explain why. Why the sudden dip? Why the change?
You start switching filters, export a CSV, and check three different tabs. Thirty minutes later, you’re still guessing.
This is the reality with most reporting tools, they’re great at showing numbers, but not at telling the story behind them. The “what” is there in bright colors, but the “why” is buried. And without that “why,” it’s nearly impossible to act quickly and confidently.
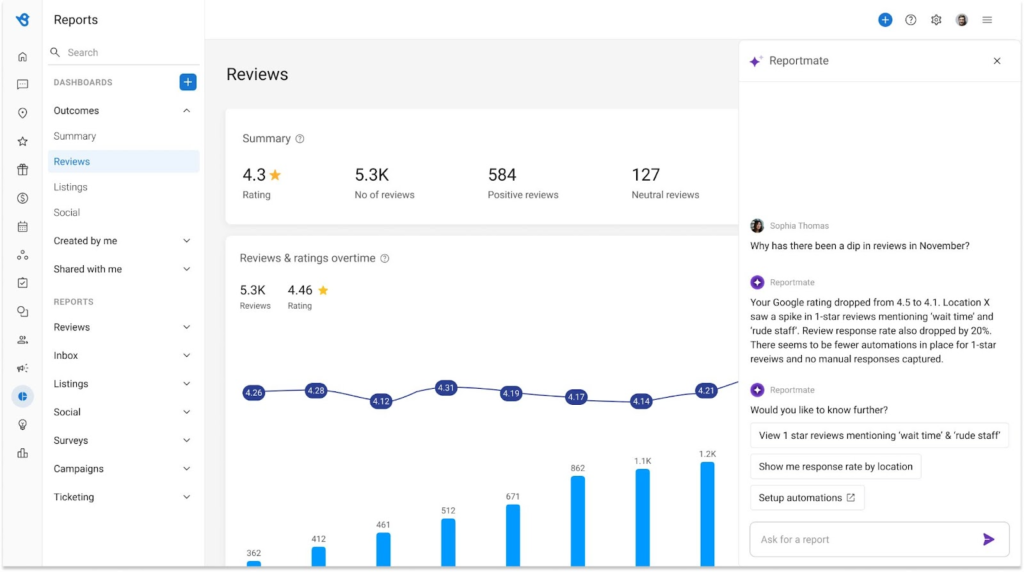
This is where AI reporting changes everything. With Birdeye’s Reporting Agent, the answer is just a question away.
Ask, “Why did location A’s rating drop this month?” and you’ll get a clear, human-readable explanation within seconds. No digging. No guesswork. Just instant clarity.
In this post, we will show how Birdeye’s Reporting Agent transforms static dashboards into smart, interactive tools that help businesses make faster, more informed decisions.
Table of contents
- What is Birdeye’s Reporting Agent?
- How does Birdeye’s Reporting Agent differ from traditional reporting?
- How Birdeye’s Reporting Agent helps your business?
- Key capabilities that make Birdeye’s Reporting Agent smarter and faster
- What outcomes does Birdeye’s Reporting Agent deliver?
- Final thoughts
- FAQs on Birdeye’s Reporting Agent
What is Birdeye’s Reporting Agent?
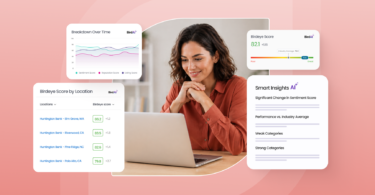
Birdeye’s Reporting Agent is an AI-powered tool that turns complex business data into simple, actionable insights. It answers questions in plain language, flags unusual trends, and explains what changed, so teams do not need to interpret charts on their own. With built-in anomaly detection and natural-language queries, it turns reporting into a faster, more interactive, and insight-rich experience.
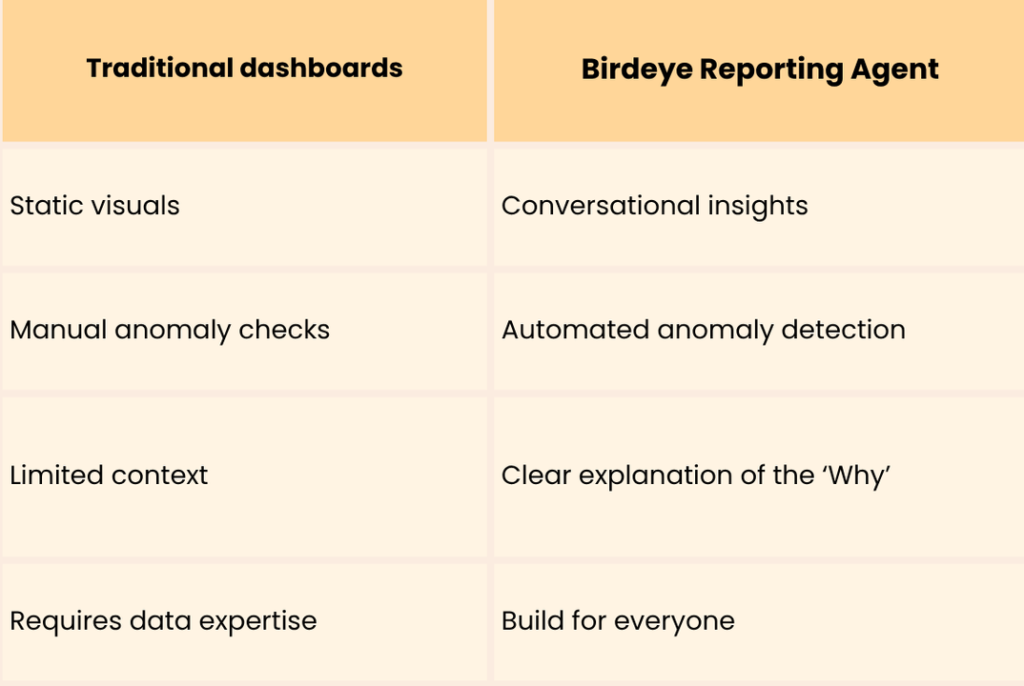
How does Birdeye’s Reporting Agent differ from traditional reporting?
Traditional reporting can feel like reading a book in a language you barely know, you see the words, but still have to work out the meaning. Birdeye’s Reporting Agent translates your data instantly into clear, actionable insights. Here’s how the two approaches stack up.
How Birdeye’s Reporting Agent helps your business?
Understanding performance should not require hours of manual analysis or technical skills. Birdeye’s Reporting Agent makes reporting more accessible, intuitive, and action-focused.
Here’s how it helps teams make better use of their data:
1. Instant clarity on metrics
No need to sift through multiple dashboards or bounce between tabs. Ask a simple question like “Why did my review volume drop last week?” and get a clear, direct, and AI-generated explanation within seconds.
2. Automated insights, no manual effort
The system proactively highlights anomalies such as spikes, drops, or trends automatically. This allows teams to stay focused on action instead of spending time on data interpretation.
3. Simplified reporting experience
Reports are presented as easy-to-read summaries, not just charts. So, instead of “figuring out the story,” you get the story ready. Users can read this and quickly understand what happened and why, without needing to interpret complex visuals.
4. Greater adoption and efficiency
When data is easier to understand, more teams use it consistently. This leads to faster decisions and greater confidence in teams across departments, locations, roles, and other areas.
By removing friction from reporting, Birdeye’s Reporting Agent helps businesses act on insights faster and with less effort.
Key capabilities that make Birdeye’s Reporting Agent smarter and faster
Now that we’ve covered the basics, here’s a closer look at the core capabilities that make Reporting Agent so effective.
Here’s how each capability works in practice:
AI-powered reporting insights via chat
With this capability, reports move from being static snapshots to acting like an explanation engine on demand. The AI connects the dots between metrics, uncovers the reasons behind trends, and remembers the context of your analysis. Each question builds on the last, so you see performance as an ongoing story instead of isolated data points.
Real-time insights
Understand performance changes instantly across Reviews, Listings, and Social. The Reporting Agent interprets fluctuations in key metrics and provides immediate, plain-language explanations, no manual digging required.
Conversational interface
Ask simple language questions like “Why is my rating down?” and get direct answers. The AI understands context, trends, and relationships between data points to deliver deeper clarity with minimal effort.
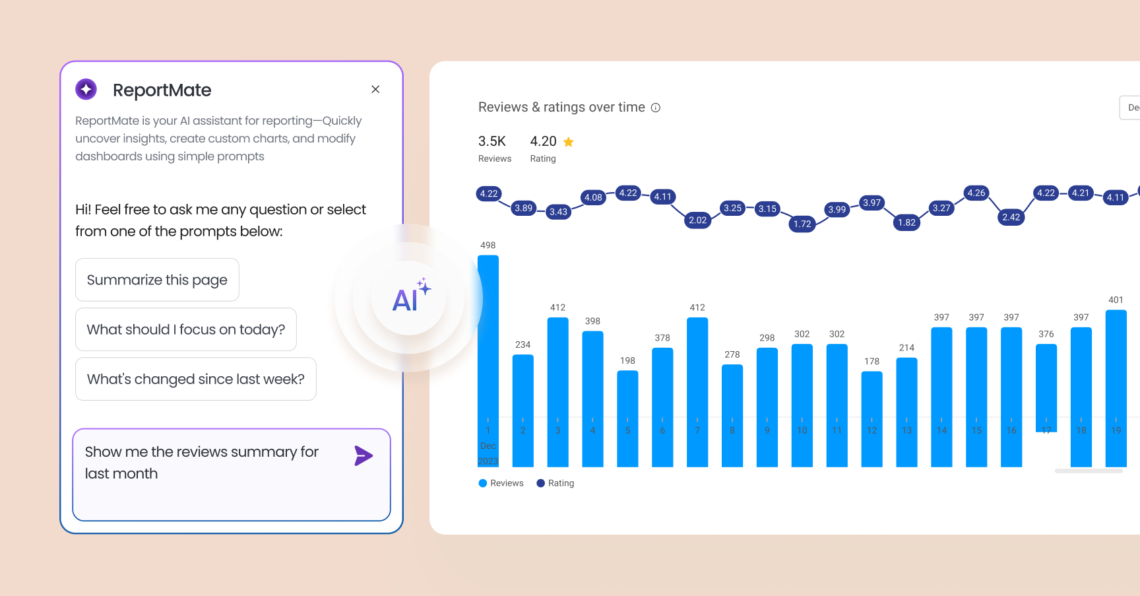
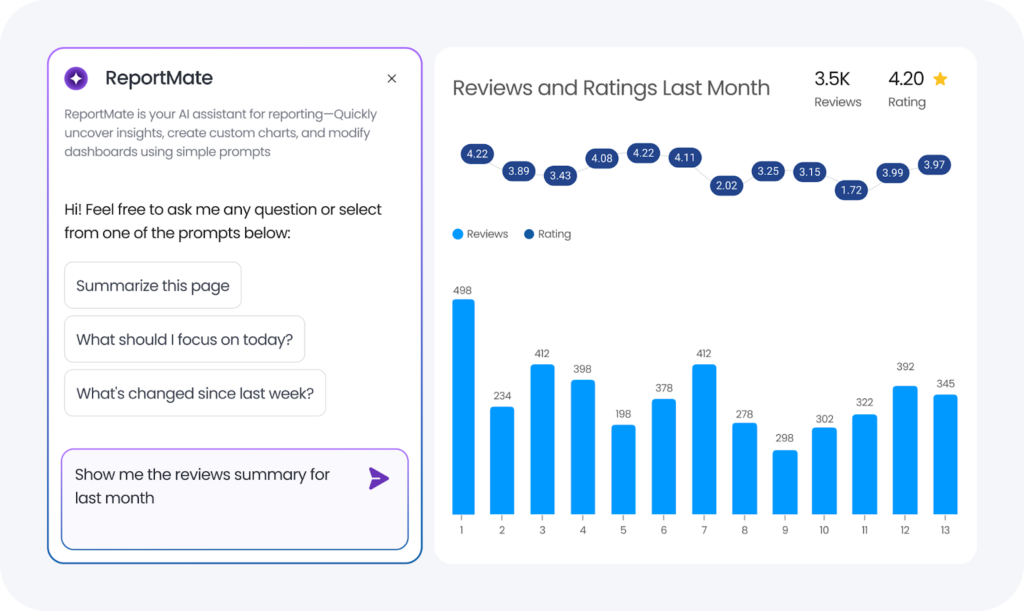
Default and custom prompts
When you open a report, you’ll see ready-made prompts to guide your analysis. You can also type your own custom queries to dig deeper. Whether you’re exploring patterns or identifying issues, prompts make analysis easy for anyone on your team.
Contextual chat history
Your conversation with the AI doesn’t reset when you move between reports. For instance, If you were discussing a dip in reviews in the Reviews module and then switch to Listings, the Reporting Copilot remembers your conversation history. It enables you to seamlessly continue analysis, regardless of where you go next.
Chat-based report customization
Update and configure reports with simple prompts. For example, “Show listing performance by region” instantly adjusts the data view, no filters or manual settings required.
Fetch reports with filters
Instead of manually applying filters, you can request filtered reports tailored to specific locations or timeframes. Example: “Get response time for my north region locations: A, B, C, D, and E” and the AI delivers exactly that view.
Add charts to custom dashboards
Easily organize your data. Use prompts like “Add this chart to the North Region Dashboard” to build or update dashboards on the go.
Schedule report distribution
Set up automated report delivery with a quick message. For instance, “Send this every Monday to my location managers” sets a recurring schedule so everyone stays informed, eliminating the need for manual effort.
Summarize visuals and reports
Convert charts and reports into easy-to-understand summaries. Perfect for sharing insights across teams or using in presentations without needing to explain every graph. For example, the AI condenses a multi-page report into a short summary that you can use in your presentation or email.
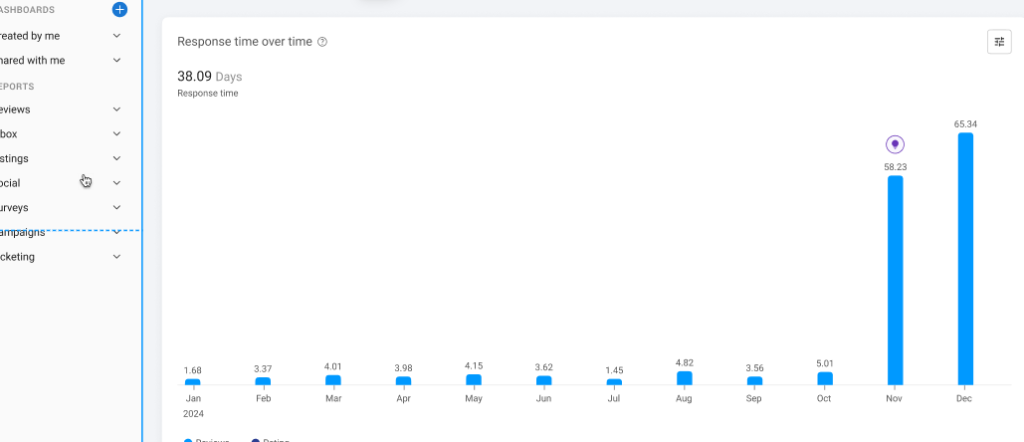
Inline chart insights (“bulbs”)
Inline chart insights give every visual a built-in guide that highlights important changes as they happen. Subtle icons point directly to areas worth attention, making it easier to spot shifts without scanning every line or bar. This keeps analysis focused on what matters most and reduces the risk of missing critical trends.
Automated anomaly detection
The system continuously monitors charts to flag unusual activity, sudden spikes, drops, or shifts in trend lines. These are detected in real time, so no important change goes unnoticed.
Interactive bulbs
When an anomaly is spotted, a small icon (or “bulb”) appears on the chart. Click to trigger relevant prompts that explain what happened and why, no need to guess or search for answers.
Visual and contextual guidance
Hover for quick summaries or click to explore deeper insights. Bulbs are embedded directly into charts, providing immediate visual context and connecting seamlessly to the conversational Copilot for further exploration.
These capabilities turn reporting into a faster, clearer, and more guided experience. Teams can quickly see what changed, understand why, and decide what to do next.
Birdeye’s Reporting Agent: Turn Complex Data into Insights
Want to see the impact of Birdeye on your business? Watch the Free Demo Now.
What outcomes does Birdeye’s Reporting Agent deliver?
Birdeye’s Reporting Agent helps organizations turn reporting into a tool that actively supports quicker decisions and stronger collaboration.
Let’s take a look at the key outcomes it delivers.
Faster insight generation
Teams can quickly identify trends, spot irregularities, and understand what’s driving them. By uncovering these insights in less time, they can address challenges or take advantage of opportunities while the information is still relevant.
Improved efficiency and productivity
Automated reporting eliminates hours of manual data gathering and formatting. This frees teams to focus on interpreting results, discussing solutions, and applying changes that have an immediate impact.
Higher report engagement
Reports are built to be visually clear and actionable, making them easier for all stakeholders to understand. This encourages more people across the organization to review findings and actively contribute to data-driven discussions.
Better decision-making
AI-generated summaries condense complex information into concise, meaningful takeaways. This clarity helps leaders make timely and well-informed choices while minimizing the risk of errors caused by misinterpretation.
These outcomes make reporting a practical, everyday tool for improving operations and achieving measurable business results.
Final thoughts
The real value of reporting is not in how much data you collect but how quickly you can act on it. Static dashboards may show the numbers, but they often miss the “why” behind them. That gap slows down decisions, creates uncertainty, and keeps insights out of reach for most teams.
Birdeye’s Reporting Agent bridges that gap. Combining conversational AI with real-time analysis brings context to your data and removes the friction from everyday reporting. Whether you are managing one location or hundreds, it gives every team member the power to ask, understand, and respond without needing to decode a chart.
In a world where clarity drives action, Reporting Agent is not just a tool. It’s a smarter way to work with data.
FAQs on Birdeye’s Reporting Agent
It’s an AI-powered reporting assistant that turns static dashboards into interactive, chat-based insights using natural language.
Instead of just showing charts, it explains what changed, why it happened, and what to do next instantly.
You can ask anything like “Why did my rating drop last week?” or “Show top-performing locations this month.”
It automatically scans for unusual patterns and flags spikes or drops with clear explanations.
Yes, it’s designed for everyone; no data expertise is needed. Just ask questions in plain language.
Yes, just type your request, and it instantly updates reports with custom views or filters.
Yes, you can schedule reports to be sent to teams regularly with a simple chat command.
Want smarter insights faster? Request a demo now to discover how Birdeye’s AI-powered Reporting Agent can make decision-making effortless.

About the Author
Vanjana Sharma
Originally published