Twitter analytics (now X analytics) is a built-in tool that helps you track tweet performance, audience behavior, and engagement metrics so you can optimize content, improve reach, and make data-driven decisions for your social media strategy.
Summary
Twitter (X) analytics gives brands and creators visibility into what content resonates, how audiences engage, and which strategies drive growth. By tracking metrics like impressions, engagement rate, follower growth, and hashtag performance, businesses can refine their content strategy and improve results over time.

In this blog, we cover how to access Twitter analytics, which metrics matter most, and how to turn data into actionable insights. We also explore how platforms like Birdeye help businesses go beyond native analytics by providing unified reporting, competitive benchmarking, and AI-driven insights to scale social performance more effectively.
Table of contents
What are Twitter analytics?
X analytics, previously known as Twitter analytics, is a free tool provided by the platform to track and measure the performance of your tweets, followers, and overall Twitter presence. This native analytics solution gives you transparent access to a wealth of data and metrics directly from Twitter itself.
With Twitter analytics, you can:
- View real-time and historical data about your account’s tweets, followers, and community
- Filter analytics data across various dimensions like date ranges, tweet types, audience demographics, etc.
- Identify your top tweets, most engaged followers, effective hashtags, and more
- Track benchmarks like impressions, engagements, click rates, audience growth, and more
Overall, Twitter analytics provides a comprehensive look into what’s resonating with your audience so you can better tailor your content strategy, adjust campaigns as needed, understand emerging trends, and make data-driven improvements over time.
How to check Twitter analytics
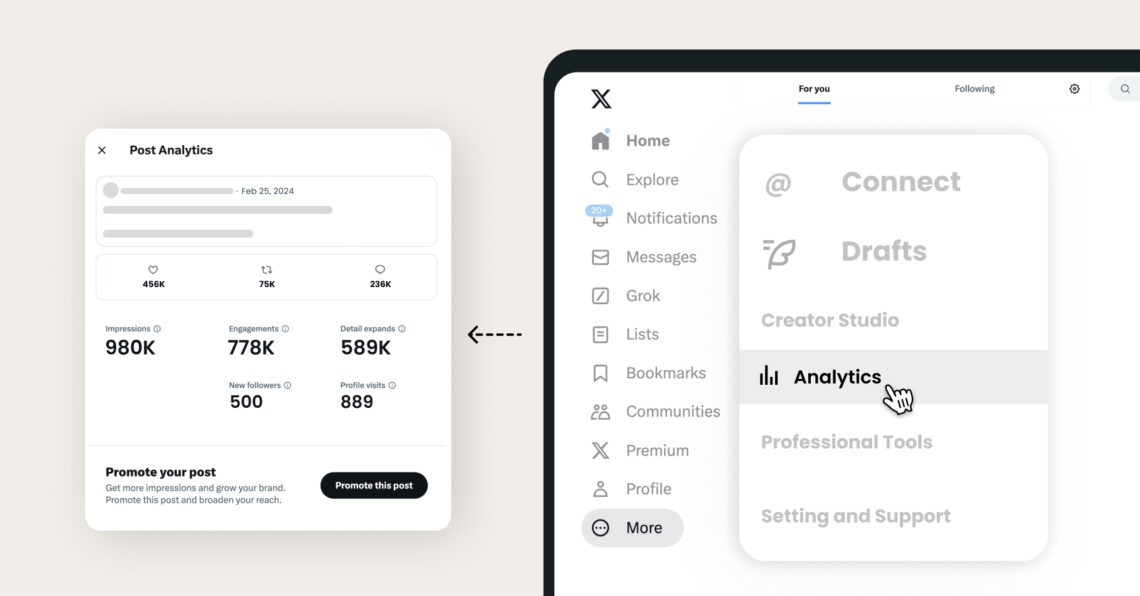
Accessing Twitter analytics on the X platform is simple if you have access to the analytics dashboard. Here’s how to find and view your Twitter analytics:
- Log into your X account from twitter.com or the mobile app
- Click “More” in the left sidebar menu
- Under the “Data” section, select “analytics”
- You’ll be directed to the Twitter analytics dashboard
Alternatively, you can visit https://analytics.twitter.com/.
If you don’t see the “Analytics” option, it may be because your account hasn’t been authorized or enabled to access analytics yet. Some types of accounts, like staff accounts for larger brands or new accounts, may need to request access.
Who are Twitter analytics for?
While anyone can view Twitter analytics for public accounts, it’s primarily a tool for social media managers, marketers, content creators, influencers, public figures, brands, publishers, and anyone responsible for managing a professional presence on X.
X analytics provides essential data for optimizing social media performance, understanding your audience, tracking ROI for social media campaigns, and growing an engaged community. It’s an indispensable resource if you leverage X for:
- Content marketing and promotion
- Brand awareness and authority building
- Product and company communications
- Customer service and support
- Influencer marketing
- Social listening and trend monitoring
Even if you’re just a casual user, Twitter analytics can lend insights about what type of content performs well, which hashtags to use, ideal tweeting frequency, and audience demographics. However, individual users may find more value in third-party Twitter analytics tools focused on more granular metrics and reporting.
Benefits of Twitter analytics
Using Twitter Analytics to measure your results and extract insights offers numerous benefits, including:

- Improve content strategy: Analytics reveals which types of content resonate most with your audience in terms of media, topics, copy, hashtags, etc. You can then refine your strategy around your top-performing content.
- Understand your audience: Detailed audience insights show you the demographics, interests, locations, and behaviors of your most engaged followers. This data enables more precise targeting in your content and paid promotions.
- Optimize sharing times: By analyzing when your audience is most active on X, you can schedule tweets during peak engagement windows to maximize visibility and interactions.
- Allocate resources: Quantitative metrics about your top posts, campaigns, and content make it easier to commit time and ad spend where it will bring the highest returns.
- Demonstrate ROI: Having clear performance data makes it easier to prove the impact of your social media efforts and justify ongoing investment in your Twitter marketing strategy.
- Identify opportunities: Analytics reveal content gaps, underutilized hashtags, emerging trends, and untapped engagement opportunities for your brand to capitalize on.
- Measure growth: Tracking follower growth, engagement rates, and conversion metrics helps you quantify audience growth, identify fluctuations, adjust as needed, and correlate social results with overall business KPIs.
How to leverage Twitter analytics
Now that you understand what Twitter analytics is and why they are valuable, let’s dive into how to best leverage this powerful tool.
Key Twitter analytics metrics to track
While the Twitter analytics dashboard contains a wealth of data points, some metrics are more critical than others for measuring your overall performance and prioritizing optimization efforts. Here are some of the top Twitter metrics to monitor and understand:
- Impressions: The total number of times your tweets were seen or delivered to timelines. This demonstrates the organic and paid reach of your content.
- Engagement: Any time a user interacts with your tweets through retweets, replies, follows, likes, profile clicks, hashtag clicks, etc. It tracks how compelling your content is.
- Engagement rate: The percentage of impressions that resulted in an engagement. This rate indicates how well your tweets capture attention. A higher rate reflects more engaging content.
- Link clicks: The number of times users clicked on any URLs shared within your tweets. This metric tracks click-through behavior and correlates to site traffic and conversions.
- Video views: For any tweets containing video, this shows the total number of views, view rate, and audience retention. It helps measure video engagement and content consumption.
- Follower demographics: Data on the key attributes of your follower audience, like gender, interests, location, language, and more. Leverage these insights for precise targeting.
- Paid metrics: If running any promoted tweets or ads, you’ll also want to track paid metrics like results rate, cost rate, total ad spend, and performance compared to forecasted targets.
How to analyze Twitter analytics data
Simply having access to all of these metrics isn’t enough — you need to know how to analyze the data in a way that produces actionable insights. Here are some tips for making the most out of Twitter analytics:
- Establish benchmarks: Compare current metrics against historical data to set realistic benchmarks and detect meaningful changes in performance over time.
- Identify patterns: Look for patterns and correlations between top-performing content, audience attributes, tactics, and other factors that may have contributed to higher engagement.
- Segment data: Use the filtering tools within Twitter analytics to segment data by dimensions like tweet type, media, topic, date range, demographics, etc. This granular view reveals deeper insights.
- Track campaigns: For any paid, influencer activation, or other Twitter campaign, be sure to tag and track performance across relevant campaign hashtags and URLs.
- Compare competitors: While you can only access in-depth data for your own account, surface-level metrics like followers and overall engagement are public. Use this to compare performance against competitors.
- Combine with other data: For a unified view of performance across all channels, import your Twitter analytics data into a centralized reporting dashboard or business intelligence tool.
- Perform sentiment analysis: While not part of native Twitter analytics, consider layering sentiment analysis to understand the perception around your brand, campaigns, hashtags, mentions, etc.
→ Birdeye’s AI-powered platform allows you to monitor customer sentiment so you can understand how customers feel about your brand.
Analyzing Twitter analytics data for tweet optimization
One of the primary reasons to leverage Twitter analytics is to continuously optimize your tweeting strategy for maximum engagement. To do this, you need to carefully study the attributes of your top-performing tweets each month to determine what’s resonating best.
Pay close attention to patterns around:
- Copy length and style: What is the ideal length and style of tweet copy that receives the most engagement? Short and snappy or longer and more descriptive?
- Hashtags used: Are there certain hashtags that significantly increased impressions and engagement? How many hashtags is the right number to use?
- Media types: Do tweets containing native video, GIFs, or images tend to receive higher engagement than text-only posts? Which visual formats perform best?
- Timing: What days and times seem to produce the highest engagement for your audience based on data?
- Topics/themes: Are there certain categories of tweets that appear to resonate more with your audience’s interests based on engagement levels?
- Tone/voice: What tone and personality does your top-performing content tend to have? Authoritative, friendly, inspirational, or some other style?
- Calls to action (CTAs): For tweets with links, which call-to-action styles and copy produce the highest click rates?
By understanding and optimizing these attributes across your top tweets, you can produce more engaging content that your audience will be more likely to interact with—leading to increased reach through impressions and engagement.
Best practices for leveraging Twitter analytics
To maximize the value you extract from Twitter analytics, keep these best practices in mind as you measure, analyze, and refine your X strategy:
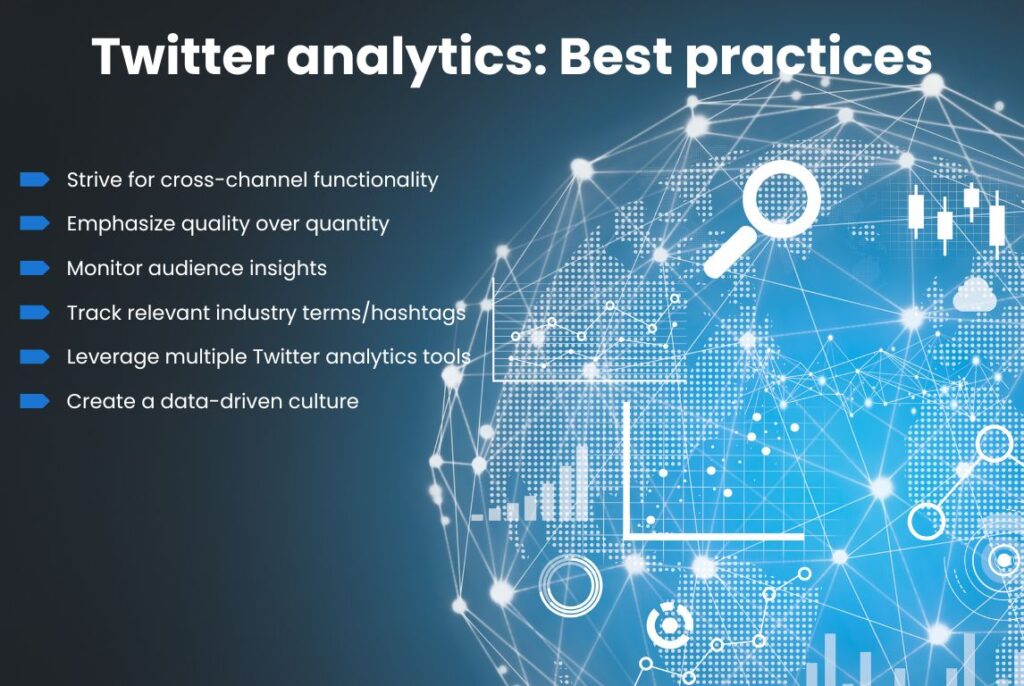
Strive for cross-channel consistency
Make sure you’re activating and optimizing consistently across all of your primary channels, like email marketing, website content, ads, and organic social, to present a unified brand experience. Align your voice, creative, and key messaging pillars across channels based on cross-channel analytics insights.
Emphasize quality over quantity
Rather than simply increasing your tweet output for the sake of volume, focus your analytics efforts on identifying the types of tweets and strategies that drive maximum engagement per post. Publishing fewer but higher-quality, more engaging tweets will produce better results.
Monitor audience insights
Regularly review the audience insights report within Twitter Analytics to stay current on your followers’ top interests, demographics, locations, etc. As this evolves, refine your content strategy and targeting to remain aligned with your ideal audience.
Track relevant industry terms/hashtags
Don’t limit yourself to campaign hashtags and brand mentions alone. Follow Analytics for relevant industry keywords, competitor brand names, trending topics, events, and other areas of interest for your business. This helps identify new opportunities and stay on top of what’s relevant to your audience.
Leverage multiple Twitter analytics tools
Twitter’s native analytics tool has limitations in terms of data granularity, historical lookback windows, and reporting functionality. Consider supplementing it with third-party X analytics solutions that provide enhanced measurement, customization, team collaboration, and insights pulling in data from other channels.
Create a data-driven culture
Make sure everyone involved in your Twitter strategy—from social media and content teams to marketing, sales, customer service, and executive leadership—has visibility into performance metrics. Foster a collaborative, data-driven culture for continuous optimization.
Take Twitter (X) marketing to the next level with Birdeye
Want to see the impact of Birdeye on your business? Watch the Free Demo Now.
Twitter hashtag analytics: How to measure hashtag performance
Twitter hashtags are a critical piece of any successful social media strategy and campaign. The real-time nature of Twitter makes it a prime channel for tapping into trending conversations and increasing the visibility of your own branded hashtags.
By tracking hashtag metrics and performance, you can amplify successful hashtags, optimize their usage in your tweets and campaigns, discover new opportunities with emerging hashtags, and demonstrate ROI for any hashtag-driven campaigns.
So, what exactly should you measure when analyzing how your hashtags are performing on Twitter? Some of the top hashtag metrics and dimensions to track include:
- Hashtag impressions: The total number of times any tweets containing your tracked hashtags were seen on Twitter. You’ll want to look at raw impressions as well as impressions per post.
- Viral rate: Percentage of owned tweets containing a tracked hashtag that were subsequently retweeted or replied to by the broader Twitter community beyond your followers.
- Engagement rate: Similar to overall tweet engagement rate, but specifically looking at the percentage of hashtag impressions that resulted in an engagement like retweets, likes, link clicks, etc.
Analyzing these hashtag metrics over time and across any specific campaigns can reveal:
- Your most popular hashtags that spur engagement
- Optimal ways to utilize and integrate hashtags with other tactics
- Audience personas that resonate best with each hashtag
- Content types and formats that increase viral spread
- Benchmarks for measuring future hashtag campaign success
- Contributors and influencers to partner with
Common ways to measure and visualize Twitter hashtag performance include:
- Hashtag analytics reporting from Twitter’s native tool
- Third-party hashtag analytics tools and monitoring dashboards
- Social media listening/analytics platforms with dedicated hashtag tracking
- Custom hashtag tracking databases and dashboards using Twitter’s public API
There’s no one-size-fits-all best solution, as each brand and campaign will have different requirements for granularity, historical lookback periods, visualizations, and integrations with other data sources.
Twitter analytics FAQs
To access your Twitter analytics, first, make sure you’re logged into your Twitter account. Click on “More” from the navigation menu on the left-hand side of your screen, then select “Analytics” from the menu. This action will direct you to your analytics dashboard, where you can view detailed statistics about your tweets’ performance, audience demographics, and more.
Yes, Twitter analytics is available at no cost for all Twitter users. This feature provides valuable insights into your tweet performance, follower growth, and engagement rates, enabling you to optimize your Twitter strategy without a financial investment.
No, Twitter does not allow users to access the analytics of other accounts. Analytics are private and designed to offer individual users or account managers insights into their own account’s performance, including engagement rates, follower demographics, and content reach.
Twitter analytics is highly accurate as it leverages data collected directly from Twitter’s servers. It offers a reliable measure of your account’s engagement, reach, and growth metrics. However, like any analytics tool, the interpretation of this data and its application to your strategy can influence the outcomes you achieve.
Measure and improve social performance with Birdeye
Twitter’s native analytics provides valuable insights, but as your social presence grows, it becomes harder to track performance across platforms, locations, and campaigns in one place.
Birdeye, the #1 Agentic Marketing Platform, helps businesses move beyond fragmented analytics by using AI agents to unify, analyze, and optimize social performance at scale.
Social AI: Optimize content and engagement across channels
Birdeye Social AI helps you manage and measure performance across Twitter (X) and other platforms from a single dashboard. Social AI agents work as a governed extension of your marketing team, using Local Intelligence to unify performance data and automate content, engagement, and reporting across locations.
- Social Publishing Agent generates and schedules content based on performance trends, audience behavior, and local signals
- Social Engagement Agent monitors interactions and drafts on-brand responses to help teams engage faster and more consistently
- Social Reporting Agent translates performance data into actionable insights, including competitor benchmarking and cross-location trends
Instead of manually analyzing dashboards, Social AI helps you continuously optimize and execute your strategy at scale.
Insights AI: Turn data into decisions
Birdeye Insights AI brings together data from reviews, social, surveys, and listings into a unified view, helping you understand performance across every location.
- Analyze customer sentiment and engagement trends across channels
- Benchmark performance with metrics like Birdeye Score
- Identify patterns and issues impacting customer experience
- Ask questions and get instant, actionable insights
Want to see how you can track, analyze, and improve your social performance across every platform? Click the banner below and watch a free demo to see how Birdeye helps you turn insights into growth.

About the Author
Shaifali Parihar
Originally published


![[Feature image] The Best Marketing Platforms for Multi-Location Brands](https://birdeye.com/blog/wp-content/uploads/Feature-image-The-Best-Marketing-Platforms-for-Multi-Location-Brands-375x195.png)