Reports AI Agent

AI Agents that instantly answer the “why” behind every metric change

The Reporting Agent explains performance shifts in real time, tracks critical outcomes across search, listings, reputation, and social, and delivers clear answers to every question.

Review Sites Logo
reports-ai-agent

Your data, analyzed, reported and explained
by an always-on AI agent

Get Instant Answers

The Reporting Agent doesn’t just show you what changed, but it tells you why. It automatically detects anomalies and, through a simple chat interface, provides instant root-cause analysis for any performance shift.

See the full picture

Access comprehensive performance reports with top metrics that matter, benchmark performance data, and compare trends over time across all your locations.

Save time and quantify ROI

Reduce manual effort with automated reports, smart alerts, and custom AI summaries, so you can spend less time reporting and more time deciding. Use built-in ROI tracking to measure time saved and real cost impact.

Reports AI Agent
Reports AI Agent

Get clear answers for every performance shift

The Reporting Agent scans your data, explains the ‘why’ behind metric changes, highlights critical shifts, and guides you to deeper insights so you can act faster with confidence.

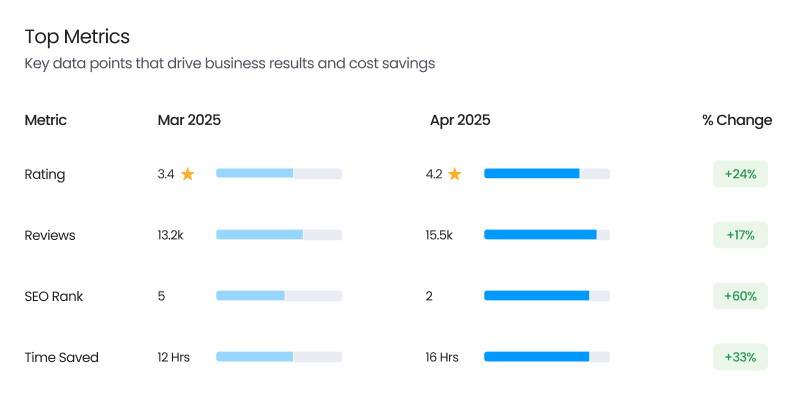
Outcome Reports

Focus on
outcome-driven success

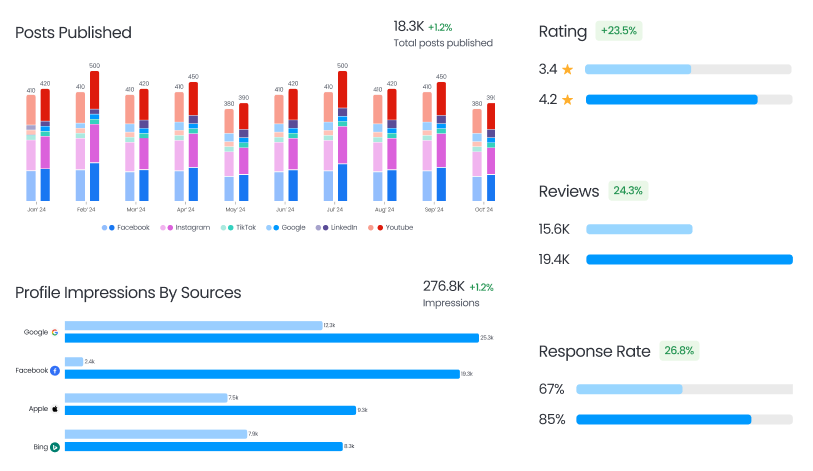
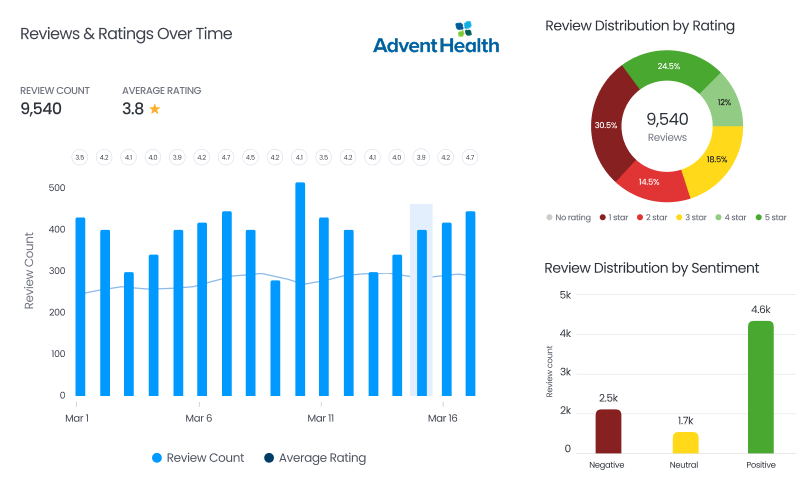
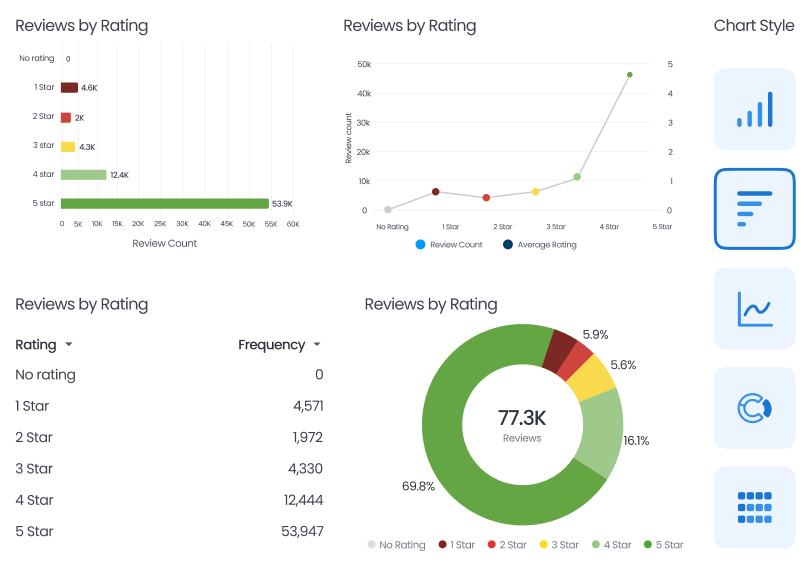
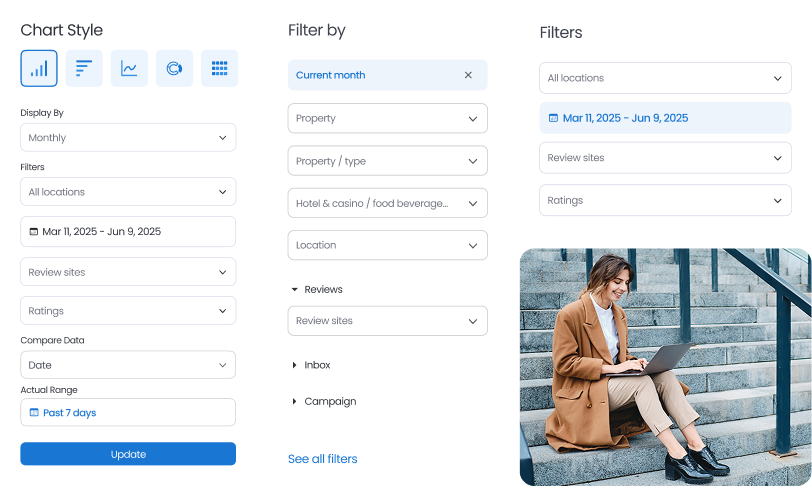
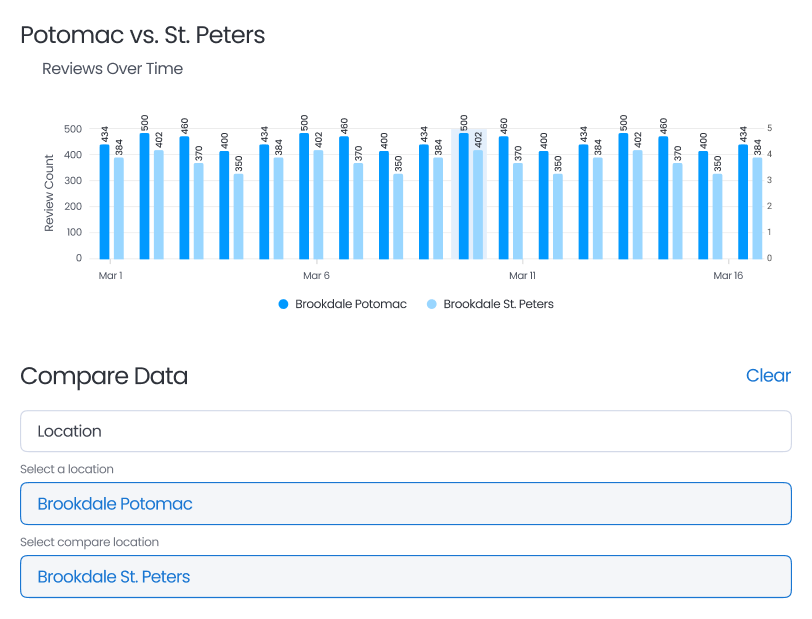
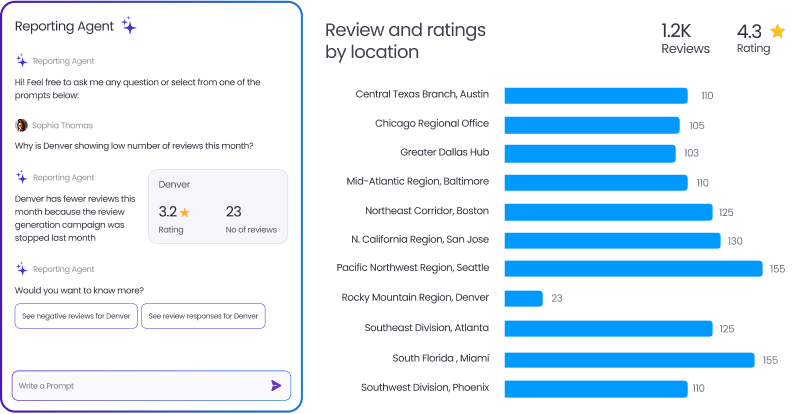
Monitor a comprehensive list of marketing success metrics that drive revenue. Compare growth over time. Go a step further and uncover actual time and cost savings with AI using the configurable calculator.

Outcome Reports
Ready-made Reports

Generate out-of-the-box
reports

Get ready-made reports for your listings, reviews, and social media marketing with no complex setup. Access the most critical metrics in a single view with interactive charts and graphs curated for multi-location businesses.

Readymade Reports
Configurable Dashboards

Track the metrics that matter

Monitor key performance metrics, track your CX teams’ progress, and keep all your locations in check with easy-to-build, drag-and-drop dashboards.

Configurable Dashboards
Visual Reports

Visualize data any way
you want

Simplify complex data by using your preferred chart and table options or by keying in on the data elements you want to focus on.

Visual Reports
Report Filters

Slice and dice your CX data

Use report filters to key in on specific insights at the brand, location, channel, and customer level.

Report Filters
Comparison Reports

Compare performance across locations

Compare performance between locations or time periods to track progress and quickly identify opportunities to improve.

Comparison Reports
Real Time & Historical Data

Track performance trends over time

With real-time and historical data, you get the best of both worlds — continuous measurements that keep you up to date and an ability to understand past, present, and emerging trends.

Real Time & Historical Data
Report Actions

Share reports with ease

Ensure consistent performance across locations and keep execs informed with shareable reports and dashboards across the spectrum of customer experience.

Report Actions

Get real-time insights across the entire Birdeye platform

Review AI Reports

Get actionable insights from your online reviews. Use AI to summarize hundreds of reviews in seconds to quickly learn what’s working — and what isn't.

Listings AI Reports

Monitor the performance of your listings across locations, track and grow profile impressions, and rank for the right keywords.

New AI Feature

Social AI Reports

Access insightful social reports to measure performance across locations. Identify top performing content, measure growth trends, and create custom reports.

Messaging AI Reports

Monitor active conversations and response times by location and employees to ensure consistent, high-quality experiences.

Survey AI Reports

Use AI-generated survey analysis and reporting to quickly gather the insights you need to make data-driven business decisions.

Ticketing Reports

Track response rate and resolution time. Monitor tickets by user, location, and status. And do it all through a single dashboard.

Frequently Asked Questions

What type of reports are included within Birdeye Reports?

Birdeye Reports comes with reports and analytics that cover the entire customer journey from search to sold. You will find comprehensive reports for Reviews, Listings, Inbox, Social, Surveys, and Ticketing.

How often are the reports updated with the latest data?

The data within all Birdeye reports is updated in real-time. You’ll have the latest data every time you refresh your screen.

What review sites do Birdeye Reports pull information from?

Birdeye Reports pulls data from over 200 review sites including major ones such as Google, Facebook, Foursquare, and industry-specific sites like Healthgrades and TripAdvisor.

What social platforms can I track using Birdeye Reports?

You can track location-level performance on Facebook, Google, Instagram, and LinkedIn.

How can one distribute reports easily to other team members or locations?

Birdeye reports and dashboards come with multiple options to customize, download and share the insights in the format and visualization of your choice.

What are the different customization options available within Birdeye Reports?

You can visualize the data in the chart type that works for you the best. You can easily add or remove data elements from a report if you want to focus on specific information. You can also compare the data over different time periods and locations to track and report relative progress.

How do you ensure the security and privacy of the data we use in these reports?

Birdeye Reports is backed by the same enterprise-grade security that has come to define the Birdeye platform over the years. Learn more about our security measures and policies here.

homeReports AI