
Customer satisfaction metrics are meant to offer clarity, but for most teams, they add noise. There’s often a gap between the feedback businesses collect and the insights they actually use.
And while surveys and star ratings still dominate most dashboards, they rarely capture how a customer truly feels. The result? They miss early warning signs and react too late, often after losing customers they didn’t even know were unhappy.
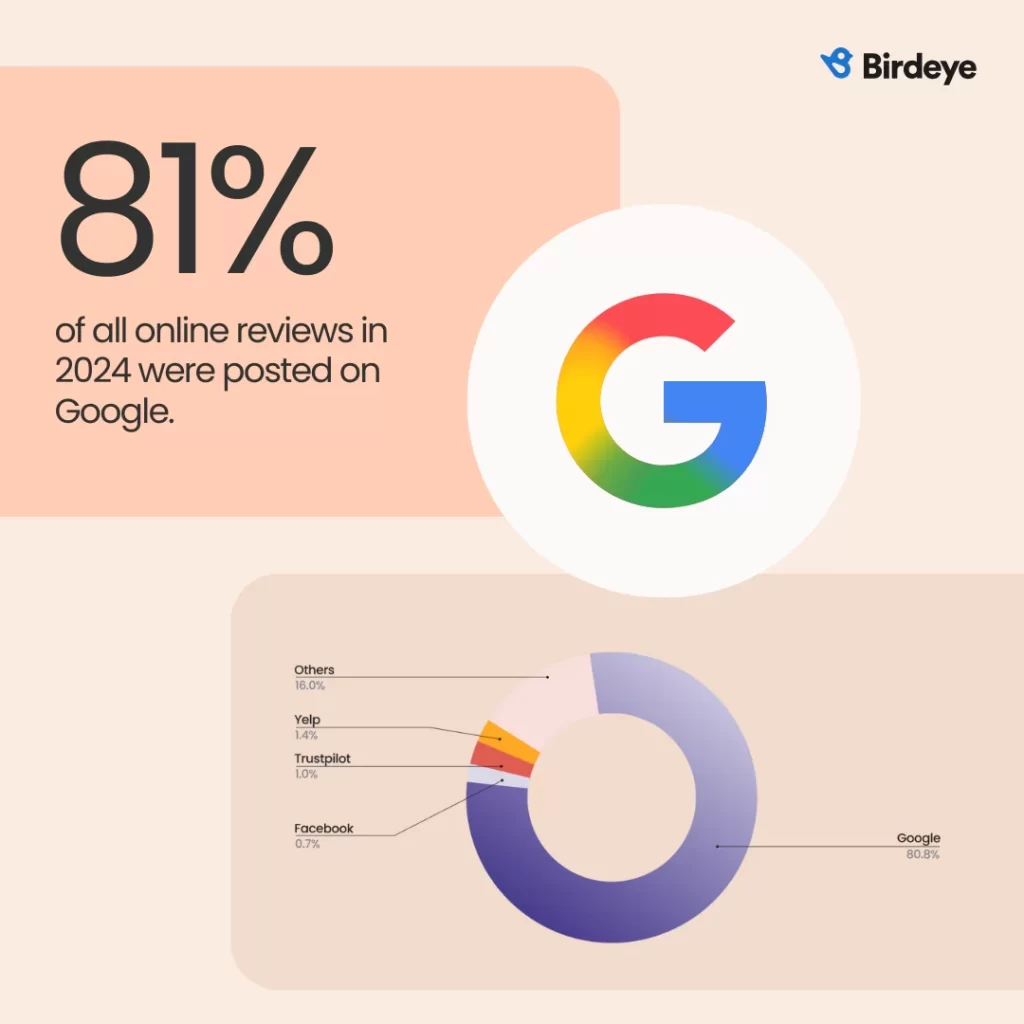
Birdeye’s 2025 State of Online Reviews report, based on data from leading global businesses, reveals just how much is changing: online review volume is up 13%, 81% of reviews are now on Google, and 73% of them get a response.

This means satisfaction isn’t just a post-sale checkpoint—it’s a public, evolving signal of your business's health.
In this blog, you’ll learn which customer satisfaction metrics are worth tracking, how to make sense of them, and how a customer engagement platform like Birdeye helps translate feedback into growth.
Metrics are mirrors, but only if you look regularly 🪞
Most teams track customer satisfaction like a fire drill—only when something’s gone wrong. But the smartest businesses treat metrics like mirrors: they check them daily, use them to fix what’s broken, and build trust before it slips. Want happy customers and fewer surprises? Start by listening when everything’s quiet.
Table of contents
- What are customer satisfaction metrics?
- 10 customer satisfaction metrics that matter (and why)
- How Birdeye GenAI tools help track and improve customer satisfaction metrics
- Customer satisfaction metrics in 2025: What’s changing?
- FAQs about customer satisfaction metrics
- Birdeye helps with customer satisfaction metrics
What are customer satisfaction metrics?
Customer satisfaction metrics are quantifiable measures that help businesses understand how customers feel about their services, products, or experiences.
These metrics are typically gathered through surveys, support interactions, reviews, and behavioral signals, and help teams evaluate whether they’re meeting or missing customer expectations.
If you’re wondering what types of metrics measure customer satisfaction, the answer depends on what you want to learn. Some metrics gauge emotional response, while others measure behavioral loyalty or ease of interaction. And while there are dozens of customer feedback tools and score types, not all are useful unless they connect back to business goals.
10 customer satisfaction metrics:

1. Customer Satisfaction Score (CSAT)
2. Net Promoter Score (NPS)
3. Customer Effort Score (CES)
4. Customer Retention Rate
5. Customer Churn Rate
6. Customer Lifetime Value (CLV)
7. First Contact Resolution (FCR)
8. Customer Sentiment
9. Customer Service Interaction Quality
10. Customer Satisfaction from Online Reviews
Effective satisfaction metrics don’t just confirm what’s working. Metrics for customer satisfaction should offer more than historical reporting. They should highlight key insights and gaps across the customer journey, pinpoint breakdowns in customer interactions, and reveal where customer expectations aren’t being met.
Here’s what meaningful metrics to measure customer satisfaction actually uncover:
- Moments where customer expectations aren’t being met, especially during onboarding or support.
- Early signals of customer churn that often go unnoticed until it’s too late.
- Patterns your customer service team hears regularly but aren’t addressed at scale.
- The difference between satisfied customers who had a decent experience and loyal customers who come back and refer others.
- Clues that predict whether someone becomes a repeat customer or vanishes after their first purchase.

If you want to measure customer satisfaction in a way that drives better decisions, the first step is to listen with intent. The second? Track the right metrics.
But with so many choices—CSAT, NPS, CES, and more—what types of metrics measure overall satisfaction most effectively? In the next section, we’ll break down the 10 most valuable customer satisfaction metrics in detail.
10 customer satisfaction metrics that matter (and why)
In this section, we’ll discuss the 10 customer satisfaction metrics that actually move the needle—why they matter, when to use them, and how to turn them into results.
1. Track Customer Satisfaction Score to capture immediate feedback
Customer Satisfaction Score (CSAT) is one of the most widely used metrics, but when applied thoughtfully, it goes beyond just capturing surface-level sentiment. CSAT asks a simple question: “How satisfied were you with your experience?”
Respondents answer on a scale, most commonly 1 to 5 (e.g., 1 = Very Dissatisfied, 5 = Very Satisfied) or sometimes 1 to 10, where a higher number indicates greater satisfaction. The response is typically collected right after a key interaction like a support call, product delivery, or service resolution.
Formula of Customer Satisfaction Score (CSAT):
(Sum of customer ratings ÷ Number of responses) × 100
📊 Calculate Your Customer Satisfaction Score:
Why it matters:
- It helps identify satisfaction in the moment, not after the fact.
- CSAT can be embedded across the customer journey, from onboarding to renewal.
- It enables rapid response: a low score can immediately trigger follow-up or escalation.
Here’s how to make it useful:
- Segment results by channel, location, or issue type
Example: If billing-related CSAT is low, focus improvement efforts there. - Compare scores across touchpoints to spot patterns or weak spots
- Read the feedback behind the scores to understand what caused the rating
- Prioritize fixes based on volume of complaints or customer impact
This way, your team isn’t just reporting CSAT—they’re using it to fix what matters.
2. Use Net Promoter Score to measure customer loyalty over time
Net Promoter Score (NPS) goes beyond satisfaction to measure long-term brand loyalty. It asks a key question: “How likely are you to recommend us to someone you know?” The responses are then grouped into three segments:
- Promoters (9–10): Highly satisfied customers who consistently advocate for your brand
- Passives (7–8): Neutral customers who are content but easily swayed by competitors
- Detractors (0–6): Unhappy customers who may spread negative feedback or churn quietly
Formula of Net Promoter Score (NPS):
NPS = % of Promoters − % of Detractors
Enter the percentage of Promoters (rated 9–10) and Detractors (rated 0–6) below.
📊 Calculate Your Net Promoter Score:
Why it matters:
- It helps identify both your biggest promoters and potential detractors
- A declining NPS often signals deeper brand trust issues, even if CSAT looks stable
- It guides strategic improvements that increase customer retention and loyalty and reduce churn
NPS is best tracked quarterly or biannually. If your CSAT is high but your NPS is lagging, it may indicate customers had a decent experience, but don’t yet feel strongly enough to advocate. That’s the gap between a satisfied customer and a truly loyal customer.
3. Capture Customer Effort Score to surface friction in key interactions
Customer Effort Score (CES) asks a simple but powerful question: “How easy was it to get what you needed?” It’s a practical way to uncover the hidden costs of doing business—whether it’s navigating your help center, resolving a billing issue, or making a return.
Customers typically respond using a 5- or 7-point scale, or by agreeing/disagreeing with a statement like:
“The company made it easy for me to resolve my issue.”
Formula of Customer Effort Score (CES):
CES = Sum of effort ratings ÷ Number of responses
Use a consistent 1–5 or 1–7 rating scale for each survey. The average score reflects how easy customers feel it is to interact with your business.
📊 Calculate Your Customer Effort Score:
For example: You run a CES survey with this 1–7 scale (where 1 = strongly disagree, 7 = strongly agree). You receive 100 responses with a total score of 620.

Your CES would be:
620 ÷ 100 = 6.2

A higher CES score (closer to 7) indicates a smoother, lower-effort experience.
Why it matters:
- CES directly impacts customer churn, often more than CSAT or NPS.
- It gives your customer support team insight into where customers struggle most.
- Tracking CES across key touchpoints (returns, escalations, account closures) helps surface pain points that standard customer satisfaction surveys may miss.
Even if customers are satisfied overall, high-effort interactions wear down trust. CES helps you catch that friction early, so you can fix the experience, not just report on it.
4. Monitor customer retention rate to track relationship strength
Customer retention rate tells you what percentage of your customers continue doing business with you over a set time period. It’s the flip side of churn—and one of the most telling signals of brand trust, product quality, and long-term customer value.
Formula of Customer Retention Rate:
((Customers at end of period − New customers acquired) ÷ Customers at start of period) × 100
Use this to calculate what percentage of your existing customers stayed with you over a given time period.
📊 Now you calculate yours:
Example:
Let’s say you started the quarter with 500 customers, gained 100 new ones, and ended with 550.

Your retention rate would be:
(550 − 100) ÷ 500 × 100 = 90%

This means you retained 90% of your existing customers, which is strong evidence that your experience and support systems are working.
When to measure retention:
- Monthly: for high-volume B2C or subscription models
- Quarterly or annually: for enterprise contracts or seasonal industries.
Why it matters:
- High retention signals that your value is clear and consistent.
- It reflects how well your onboarding, product, and support efforts work together.
- Cohort-based retention (e.g., by product line or acquisition source) helps identify what’s working and what’s not.
If you want to improve customer experience, retention is the metric that proves you’ve earned long-term trust.
5. Track customer churn rate to catch silent dissatisfaction early
Customer churn rate shows how many customers stop engaging with your business or cancel within a specific period. Churn often happens quietly—without complaints or bad reviews—making it easy to miss until revenue or repeat sales begin to drop.
Formula of Customer Churn Rate:
(Customers lost during period ÷ Customers at start of period) × 100
This shows the percentage of customers who stopped doing business with you over a defined time period.
📊 Calculate Your Customer Churn Rate:
Example:
Let’s say you started Q1 with 500 customers and lost 50 by the end of the quarter.
Your churn rate would be:

(50 ÷ 500) × 100 = 10%

A 10% churn rate means 1 in 10 customers left, possibly without giving feedback or indicating dissatisfaction.
Why it matters:
- Rising churn may point to issues in service quality, product fit, or price sensitivity.
- It reflects real customer behavior, not just what they say in surveys.
- helps validate whether your customer satisfaction metrics match actual outcomes.
Churn should be reviewed alongside CSAT and CES surveys. If customers claim they’re satisfied but leave anyway, it’s often due to unmet expectations, unclear value, or better alternatives. Spotting this gap early helps reduce risk—and protect revenue.
6. Use Customer Lifetime Value to link satisfaction with revenue
Customer lifetime value (CLV) estimates how much revenue you can expect from a customer throughout their relationship with your brand. It’s not just a finance metric—it’s a powerful way to tie your customer satisfaction process directly to growth.
Formula of Customer Lifetime Value (CLV):
CLV = Average purchase value × Purchase frequency × Customer lifespan
This estimates the total revenue a business can expect from a single customer over the course of their relationship.
📊 Calculate Your Customer Lifetime Value:
Let’s say:
Your average customer spends $100 per order
They purchase 4 times a year
And stay with your business for 5 years


Your CLV would be:
 $100 × 4 × 5 = $2,000
That means each retained customer is worth around $2,000 in revenue over their lifetime.
Why it matters:
- Helps identify which customer segments drive long-term value.
- Connects improvements in customer satisfaction to real business outcomes.
- Enables smarter investments in service, retention, and personalization.
Tracking CLV over time helps connect customer satisfaction with bottom-line performance.
7. Monitor First Contact Resolution to assess support effectiveness
First Contact Resolution (FCR) measures whether a customer’s issue was resolved in a single interaction, without needing follow-ups, callbacks, or escalations. It’s a direct indicator of how competent, clear, and empowered your frontline support is.
Formula of First Contact Resolution (FCR):
FCR = (Total resolved cases on first contact ÷ Total number of cases) × 100
This shows the percentage of customer issues resolved in a single interaction—no callbacks or escalations.
📊 Calculate Your First Contact Resolution:
Why it matters:
- It reflects the quality of your customer service interaction, not just the speed.
- High FCR is correlated with increased customer satisfaction and reduced operational costs.
It prevents frustration that leads to negative reviews or quiet churn.
Customers often remember the effort it took to get help, not just the outcome. A quick, first-time resolution boosts trust, while repeat contact wears down even loyal customers. Tracking FCR helps close that gap.
8. Monitor customer sentiment to capture unfiltered emotional feedback
Customer sentiment score tracks the tone and emotion behind customer responses, reviews, or messages. It’s typically measured using natural language processing (NLP) or GenAI tools like Birdeye Insights AI that detect patterns across text.
Formula of Customer Sentiment Score:
Customer Sentiment = ((Positive – Negative) ÷ Total responses) × 100
This metric helps you quantify how your customers feel based on feedback, survey language, or review tone analysis.
📊 Calculate Your Customer Setiment Score:
Why it matters:
- It adds emotional context to numeric scores like CSAT and NPS.
- It helps uncover themes that surveys alone may not surface.
- It empowers teams to address not just problems, but also how customers feel about them.
Whether you're analyzing support chats or review comments, monitoring overall customer sentiment helps you read between the lines. It tells you whether customer feedback is mildly inconvenient or emotionally frustrating—critical for maintaining customer trust.
9. Evaluate customer service interaction quality
One bad interaction can undo an otherwise great experience. That’s why tracking the quality of each customer service interaction is so important. Go beyond resolution time and ask: Was the response helpful, empathetic, and complete?
Formula of Customer Service Interaction Quality:
(Number of high-quality interactions ÷ Total interactions evaluated) × 100
This metric measures the percentage of customer interactions that meet or exceed service standards—such as clarity, empathy, and issue resolution.
📊 Now you calculate yours:
Why it matters:
- It helps standardize experience across agents, locations, or regions.
- It reflects how well your customer support team represents the brand.
- It ties back to repeat business—most loyal customers stay because of great service.
Consider adding short CSAT survey questions after key interactions and regularly reviewing call or chat transcripts. Use these insights to coach your teams and improve outcomes and satisfaction.
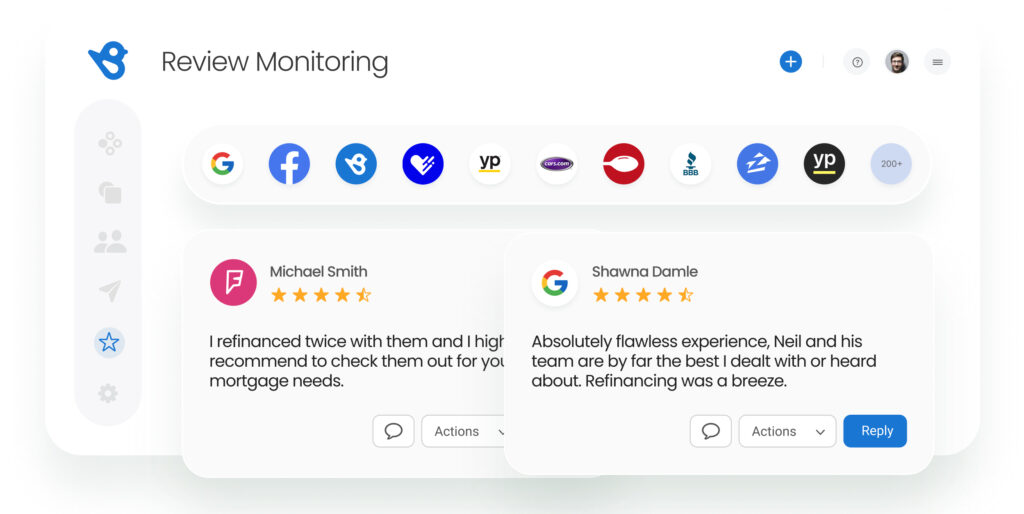
10. Use online review scores as a real-time satisfaction metric
Your customers may never fill out a formal survey, but they’ll leave a review. As per Birdeye’s online review trends of 2025, 81% of reviews are now on Google, and your public reputation has become a real-time pulse check on customer satisfaction levels.
Why it matters:
- Review ratings reflect satisfaction in the wild, outside of scripted survey formats.
- They influence brand perception for new and repeat customers.
- They can be tracked over time, location, and issue type to identify patterns.
To measure review-based satisfaction effectively:
- Track volume and average score.
- Analyze sentiment in review comments.
- Compare results across locations or service lines using customer satisfaction measurement tools.
Platforms like Birdeye make it easy to centralize this data and spot trends, whether you’re managing three locations or three hundred.
Which of These 10 Customer Satisfaction Metrics Are You Tracking?
Want to see the impact of Birdeye on your business? Watch the Free Demo Now.
How Birdeye GenAI tools help track and improve customer satisfaction metrics
Collecting customer satisfaction feedback is just the start. What matters more is how fast your team can turn that feedback into action, and that’s where Birdeye tools make the difference.
Birdeye offers an all-in-one platform to help businesses measure customer satisfaction, decode trends, and proactively close experience gaps. Whether you manage 5 or 500 locations, its tools are built to help your entire company stay in sync with what customers are saying—and feeling.
Here’s how Birdeye helps turn metrics into momentum:
- Omnichannel feedback collection: Create customer feedback forms, CSAT surveys, and CES surveys via email, SMS, and web.
- Response automation: Personalize replies using your brand tone to increase customer loyalty and protect your reputation.
- Insightful dashboards: Track key customer satisfaction metrics like CSAT, NPS, and FCR across teams, channels, and locations.
- Smart review monitoring: Automatically tag sentiment and surface hidden themes using GenAI.
- Predictive analytics: Spot early churn risks using AI models based on customer effort, resolution trends, and engagement history.
- Location benchmarking: Compare customer satisfaction levels across branches to identify outliers and scale best practices.
And since Birdeye integrates directly with your CRM, ticketing, and review platforms, teams aren’t left guessing. They act based on real-time customer insights, not end-of-quarter summaries.
Now let’s see how real businesses use Birdeye GenAI to improve satisfaction at scale.
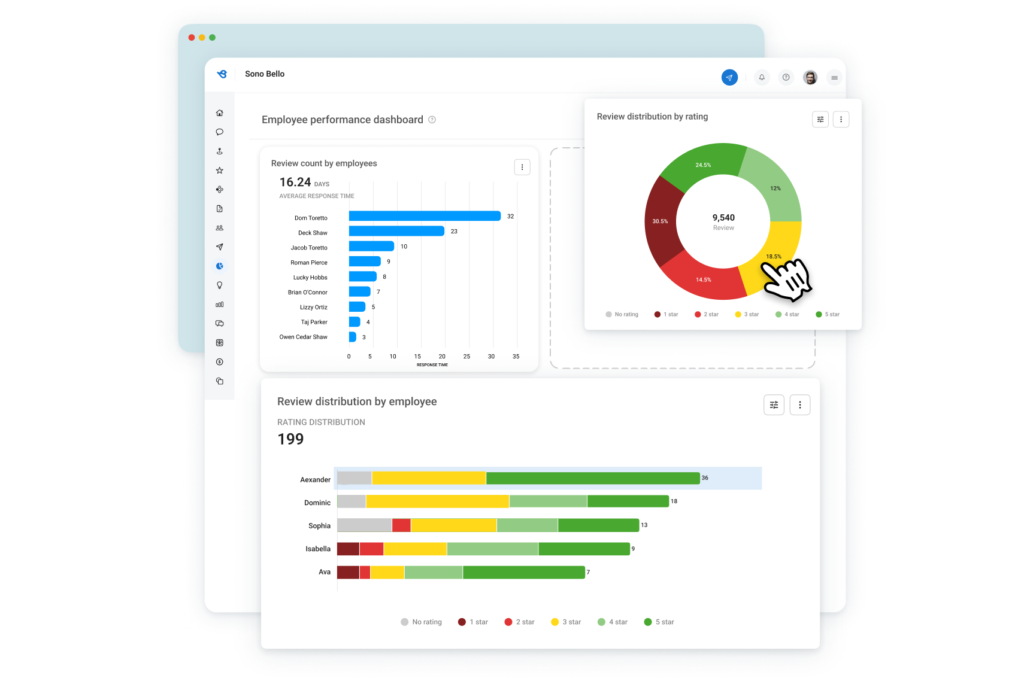
Sono Bello boosted customer satisfaction by streamlining feedback and review management
With over 80 locations across the U.S., Sono Bello needed a scalable way to gather, analyze, and respond to patient feedback—without overwhelming individual clinics. Disjointed reviews and inconsistent processes made it difficult to track customer satisfaction levels or improve based on feedback.
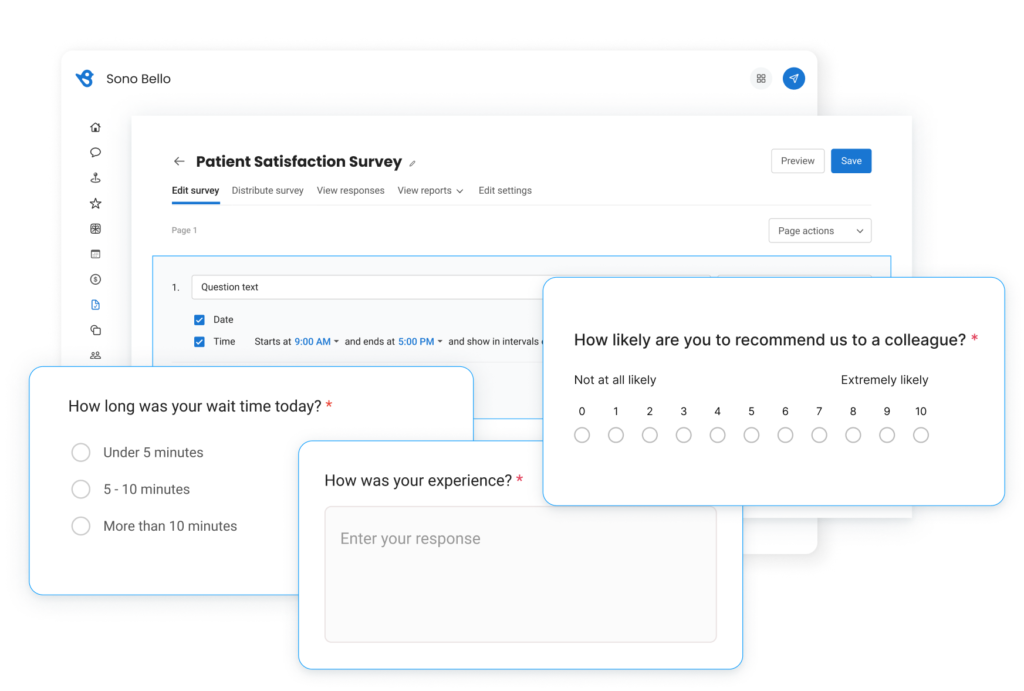
Solution: Using a combination of Birdeye Reviews AI, Surveys AI, and Insights AI, Sono Bello automated their review collection process and launched GenAI-powered surveys to capture post-visit feedback at scale.
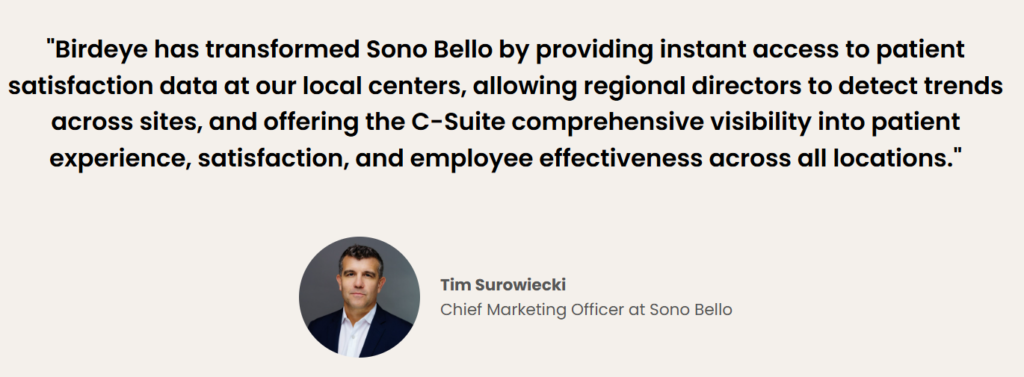
With Birdeye’s response suggestions, the team could quickly and consistently reply to patients—protecting their reputation while improving operations in real time.
Results:
- 8X growth in positive reviews across all locations
- Dramatic improvement in customer satisfaction score visibility
- Faster response turnaround and unified patient experience across the network
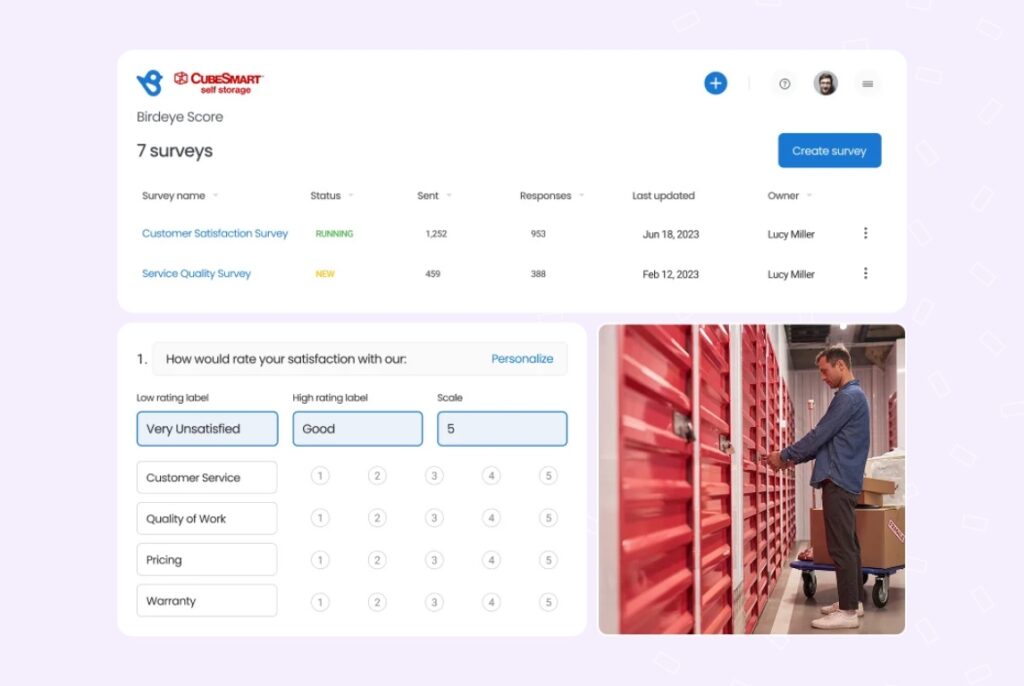
National Storage Affiliates unified data to drive satisfaction across 1,100+ properties
Managing feedback across 1,100+ properties, National Storage Affiliates struggled to track customer satisfaction metrics consistently or act on trends across regions. Siloed tools and manual processes delayed response times and made it difficult to identify service issues early.

Solution: With Birdeye Reviews AI, Surveys AI, and Insights AI, NSA centralized all customer feedback into a single dashboard. They launched GenAI-powered CSAT surveys and review automation across every property—using Birdeye to detect satisfaction trends, manage responses, and improve team accountability.
Results:
- 370% growth in review volume
- 89% increase in customer engagement with feedback
Improved customer effort score through faster resolutions and simplified service flows. - Region-level benchmarking that enabled NSA to standardize quality and scale best practices.
Customer satisfaction metrics in 2025: What’s changing?
What the average customer expects today looks very different from just a year ago. In 2025, satisfaction isn’t a score tucked away in a quarterly report—it’s an ongoing conversation happening across reviews, surveys, chats, and social platforms.
And it’s more public, more measurable, and more important than ever.
Businesses that rely solely on CSAT and NPS are now expanding into deeper, more predictive metrics—like customer health score, customer sentiment, and behavioral feedback tied directly to the customer experience.
But what’s driving the shift?
Public feedback is overtaking private surveys
Consumers are more comfortable sharing their thoughts publicly, making online reviews a critical part of the satisfaction mix. And unlike structured csat score responses, reviews provide open-ended qualitative data that reveals real emotion and context.
Actionable insights > isolated scores
Executives no longer just want numbers—they want actionable insights that show how product quality, support, and trust impact growth. Metrics are only useful when they tie to business outcomes like retention, upsell, or how a customer makes repeat decisions.

Metrics are becoming boardroom-level KPIs
Today, CSAT, CES, and review sentiment are treated as key performance indicators, not just CX team scorecards. They influence strategic decisions across operations, marketing, and even product roadmaps.
Ease is the new loyalty
Expectations for self-service options, low-effort interactions, and seamless resolutions are higher than ever. Satisfaction now hinges on how well your systems work together to meet needs without delay or confusion.
The takeaway? Your customer satisfaction metrics shouldn’t just report on the past—they should guide how your entire company shapes the future of every customer relationship.
FAQs about customer satisfaction metrics
The four key metrics are Customer Satisfaction Score (CSAT), Net Promoter Score (NPS), Customer Effort Score (CES), and Customer Retention Rate—each offering a different lens into the customer experience.
Customer satisfaction surveys help identify where you’re meeting or missing expectations, making it easier to spot patterns and improve customer satisfaction in real time.
Outside of surveys, businesses track online reviews, customer health score, product quality signals, and behavior trends. These offer richer, actionable insights than scores alone.
Absolutely. High customer satisfaction scores and positive reviews build trust and credibility—making it easier to win new customers and keep customers happy.
Birdeye helps with customer satisfaction metrics
Understanding and tracking the right customer satisfaction metrics is no longer optional—it’s essential to delivering better outcomes across the customer experience. But knowing what to measure is only half the battle.
The real challenge lies in turning those metrics into decisions that help your entire company serve better, grow faster, and stay ahead.
That’s where Birdeye makes a measurable difference.
Whether you're running customer satisfaction surveys, collecting customer feedback, or analyzing CES surveys and online reviews, Birdeye brings all of it into one unified platform.

From customer satisfaction score, net promoter system to customer effort, sentiment analysis to benchmarking by location, every signal is tracked, surfaced, and simplified.
With Birdeye, you don’t just measure satisfaction. You actually improve customer satisfaction at every touchpoint, across every location.

About the Author
Shruti Dugar
Birdeye
Originally published