As a small business owner, you’ve honed killer instincts and sharp intuition that guide many decisions. After years of hands-on experience, your gut feeling about the next strategic move, hot-selling product, or customer need is often spot on.
But in our increasingly data-driven world, relying solely on intuition or guesswork is no longer enough. Combining your intuition with objective data analytics can turbocharge your marketing objectives and business growth.
What is small business data analytics?
Small business data analytics involves collecting, organizing, and analyzing data about your business operations, website traffic, customer behaviors, marketing performance, and other key areas. The insights gleaned from data analytics tools for small businesses can inform smarter business decisions, solve problems, identify opportunities, and optimize strategies.
Think of small business data analytics as your personal team of experts. They help you understand and measure things you used to rely on your gut feelings for. Using data, you can confirm your instincts and spot things you might have missed, all while following proven best practices.
This blog explores how small business analytics empowers you to understand your customers and operations and implement digital marketing tactics more objectively.
Table of contents
- Types of data analysis techniques for small businesses
- How can businesses benefit from using analytics on their website?
- Best practices for data analytics for small businesses
- Top 5 free data analytics tools you need
- 5 questions you need to ask before employing a small business data analytics solution
- Analytics for small businesses: Make smarter decisions in minutes
- FAQs on analytics for small business
- Supercharge your small business with Birdeye Analytics
Types of data analysis techniques for small businesses
While there are many advanced data analysis techniques, here are some essential ones that are particularly useful for small businesses:
1. Descriptive analytics: This is the foundation of data analysis. It focuses on summarizing and describing your data to understand what happened.
Common techniques include measures of central tendency (average, median) and dispersion (range, standard deviation) and charts and graphs to visualize the data.
Real-use case: A clothing boutique analyzes sales data to see which styles and colors sell best by gender and age group (average sales per category).
2. Diagnostic analytics: Once you understand what happened (descriptive), you can delve deeper into why it happened. Diagnostic analytics helps identify the root causes of trends or patterns in your data.
This might involve techniques like correlation analysis to see if changes in one variable are linked to changes in another.
Real-use case: A physical therapy clinic reviews appointment data to identify if there’s a correlation between specific therapists and higher patient cancellation rates.
3. Predictive analytics: This powerful technique leverages historical data and statistical models to predict future outcomes.
Real-use case: You might use predictive analytics to forecast future sales or identify customers at risk of churning (canceling their service).
4. Prescriptive analytics: This takes things a step further by not only predicting what will happen but also recommending the best course of action. It uses advanced algorithms and machine learning to analyze scenarios and suggest optimal decisions.
Real-use case: A law firm uses historical case data and client profiles to recommend the best legal strategies for new cases with similar characteristics.
Remember, the type of data analysis technique you choose will depend on your specific business goals and the questions you’re trying to answer. If you want to know your social media analytics, begin with that.
Don’t get bogged down in complex techniques; start with the basics and focus on getting actionable insights from your data.
The simplest is installing data analytics on your website to analyze traffic and user behavior.
Let’s understand those in detail.
Analytics – An Investment That Boosts Your Small Business!
Want to see the impact of Birdeye on your business? Watch the Free Demo Now.
How can businesses benefit from using analytics on their website?
Website analytics is a powerful subset of data analytics focusing specifically on website traffic and user behavior. Here are some key ways website analytics can empower small businesses:
Understand your website traffic
Website analytics tracks how people find your site, what pages they visit, and how long they stay. This data helps you understand your target audience, their interests, and how they navigate your website. By identifying popular pages and analyzing user behavior, you can optimize your website for a better user experience and potentially increase conversions (like sales or signups).
Increase ROI and conversions
Website analytics can help you track the effectiveness of your marketing campaigns and ROI. By measuring conversions (e.g., purchases, form submissions) and analyzing which traffic sources lead to the most conversions, you can optimize your marketing spend and focus on strategies that deliver the best results.
Check how Birdeye Reports is revolutionizing business intelligence with actionable insights.
Improve your sales funnel
The sales funnel shows the steps a customer takes from first hearing about your product to making a purchase. Website analytics can help you find problems in this process, like pages where many visitors leave quickly or checkout steps that take too long. Fixing these issues can make the sales funnel smoother and increase the number of people who buy from you.
Stay ahead of your business competition
Analyzing industry trends and competitor website traffic data (using paid analytics tools) can provide valuable customer insights into your market. This knowledge can help you differentiate your brand, identify new marketing opportunities, and stay ahead of the curve.
Identify improvement areas
Website analytics can expose technical issues on your website, such as slow loading times or broken links. Addressing these issues can improve website performance and user experience.
Gain insights into customer behavior
Website analytics gives you detailed information about how people use your website. By looking at how visitors behave, you can learn what your customers like, find out what interests them, and tailor your website content and services to suit their needs better.
Check the top 5 customer experience KPIs and metrics you should track.
Best practices for data analytics for small businesses
Even with limited resources, hands-on marketing automation for small businesses can work effectively. All you need to do is follow some of these best practices:
1. Identify your goals
Before diving into data, clearly define your business goals:
- Are you looking to increase website traffic, improve customer satisfaction, or boost sales?
- What business questions are you trying to answer with analytics?
- Align your analytics to strategic goals and priorities
- Example metrics: sales revenue, customer acquisition costs, website traffic
Knowing your goals and key SWOTs will help you determine the data most relevant to analyze.
How is SWOT analysis important in data analytics?
A SWOT analysis is a strategic planning framework that helps you identify your business's Strengths, Weaknesses, Opportunities, and Threats. Data analytics plays a vital role in a SWOT analysis by providing the data you need to assess each factor accurately.
By performing this analysis on your data analytics, you can:

✅Identify strengths like high-value datasets or skilled analysts
✅Uncover weaknesses like incomplete tracking or outdated tools
✅Find opportunities for new analytics applications or integrations
✅Mitigate threats like data quality issues or lack of stakeholder buy-in

For example, website traffic data can help you identify your website's strengths (e.g., high-performing pages) and weaknesses (e.g., pages with low conversion rates).
2. Ensure data quality and governance
Inaccurate, incomplete, or inconsistent data will undermine your analytics efforts. Establish processes to validate data quality and govern how data is collected and managed. For that, do the following:
- Audit existing data sources
- Document data definitions
- Implement tracking standards
- Regularly review for anomalies
3. Focus on the right data for your needs
Different companies and use cases require analyzing different datasets. Align your data strategy to the metrics and areas most pivotal to your specific business, like:
- Transactional data
- Customer data
- Marketing/advertising data
- Operational data
Are you using the right Facebook analytics tool to make your data work for you?
4. Visualize KPIs in user-friendly dashboards
Well-designed dashboards make analytics insights easily digestible and allow stakeholders to monitor performance at a glance. Highlight the most meaningful marketing KPIs and track:
- Overall health/performance
- Exception spotlights
- Drill-down capabilities
5. Share and collaborate on insights
Strategic use of data requires company-wide buy-in. Promote a data-driven culture by regularly discussing analytics and applying the insights collaboratively by:
- Scheduling reviews
- Doing cross-functional participation
- Preparing action plans
7. Test, learn, and optimize
Continuously leverage your analytics program to experiment, measure results, and optimize tactics and strategies. So do the following:
- A/B test
- Track historical comparisons
8. Invest in the right data analytics tool
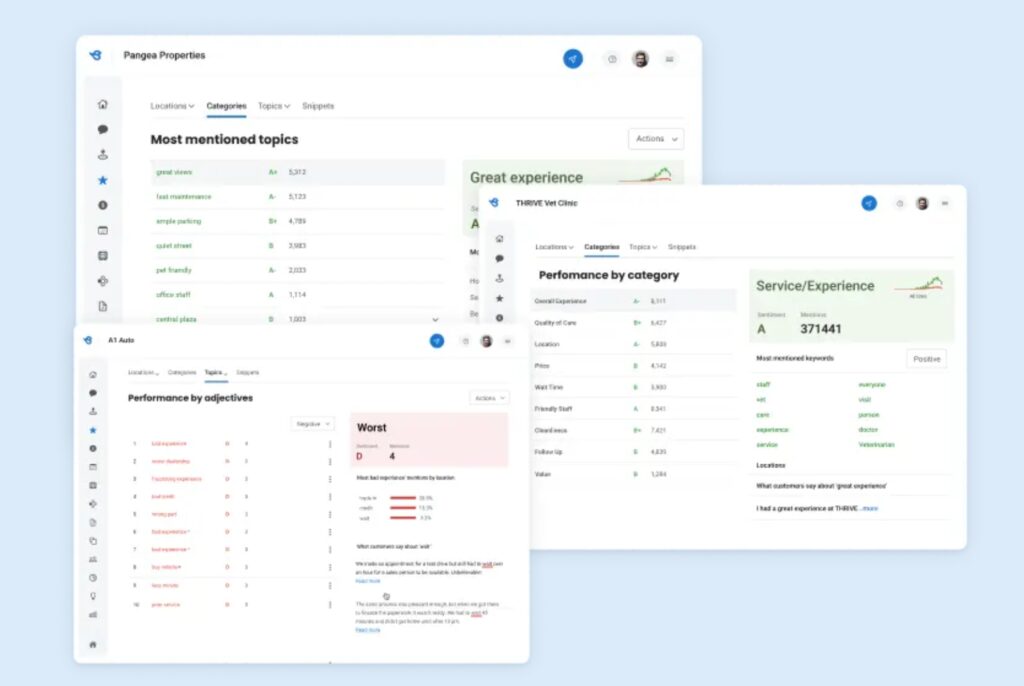
While some free tools are available, robust small business analytics software designed for your needs and resources will extract more value over utilitarian options. Look for:
- Usability for non-analysts
- Automated reporting/alerts
- Predictive capabilities
Use Google My Business analytics to better your SEO performance
Top 5 free data analytics tools you need
Many robust data analytics tools for small business are available in the market. But you can get started with these free options for your small business:
- Google Analytics (for website analytics)
- Microsoft Power BI (for business intelligence)
- RapidMiner (for data mining and machine learning)
- KNIME (for data integration, mining, and analysis)
- Tableau Public (for data visualization and sharing)
5 questions you need to ask before employing a small business data analytics solution
While numerous data analytics tools are available, choosing the right one for your business is crucial. Here are some questions to consider:
- Usability: Is the tool user-friendly for someone without a strong technical background?
- Scalability: Can the tool grow with your business needs?
- Cost: Does the tool fit your budget? There are many free data analytics tools available for small businesses.
- Integrations: Does the tool integrate with your existing business software, such as your CRM or accounting system?
- Security: Does the tool offer robust security features to protect sensitive business data?
Pro-tip: Start simple. Don't get overwhelmed by the vast amount of data available. Begin by focusing on a few key metrics that align with your goals. These could be website visits, conversion rates, social media engagement, or customer reviews.
Analytics for small businesses: Make smarter decisions in minutes
Don’t let data be a four-letter word for your small business. Embracing data analytics can be a game-changer for better decisions, customer experiences, and sustainable business growth. With a healthy balance of intuition and data analysis, unleash your company’s full potential.
FAQs on analytics for small business
You don’t need to be a data whiz to benefit! Start small by focusing on a few key metrics relevant to your business goals. Many analytics tools offer automated reports, saving you time in the long run.
While larger companies have dedicated analysts, small businesses need employees who can wear multiple hats. Look for skills in data collection, SQL, spreadsheet modeling, dashboard/visualization tools, and basic statistics. Or hire an affordable freelance analyst.
The optimal data cadence varies based on the metrics, data sources, and business needs. Some datasets like website traffic may need weekly or monthly reviews. While annual or quarterly analysis is common for higher-level business performance, strategic planning, etc. Prioritize regular routines.
Common datasets for small business analytics include website traffic and behavior, marketing campaign performance, sales and financial data, customer information, social media metrics, inventory/operations data, and more. The specific data you analyze depends on your business model and goals.
Not necessarily! Big data refers to massive datasets, but even small businesses can benefit from it in surprising ways. For example, analyzing social media trends can give you valuable insights into your target audience.
Many user-friendly and free data analytics tools are available, such as Google Analytics, Facebook Insights, and Mailchimp. These can help you start your data analysis journey.
Supercharge your small business with Birdeye Analytics
With so much information at your fingertips, knowing where to look and what it all means can be overwhelming. That’s where Birdeye Analytics comes in, offering a powerful suite of tools specifically designed to empower small businesses.
Here’s how Birdeye can transform your data into actionable insights and elevate your business:
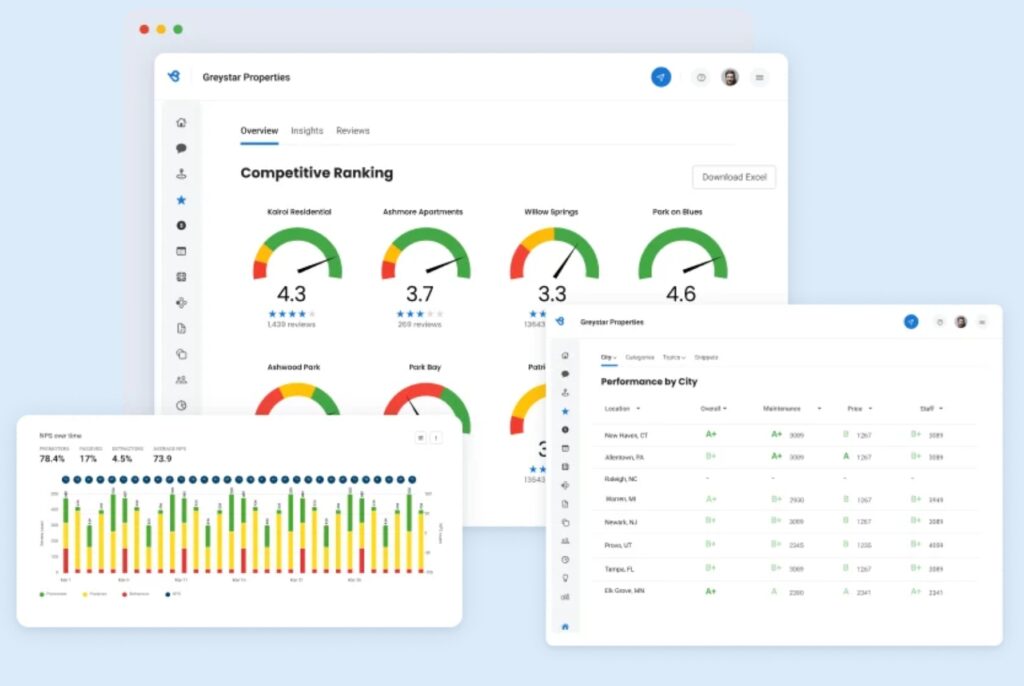
- Seamless data integration: Effortlessly collect data from all your touchpoints – online reviews, website traffic, social media, and more – in one centralized location.
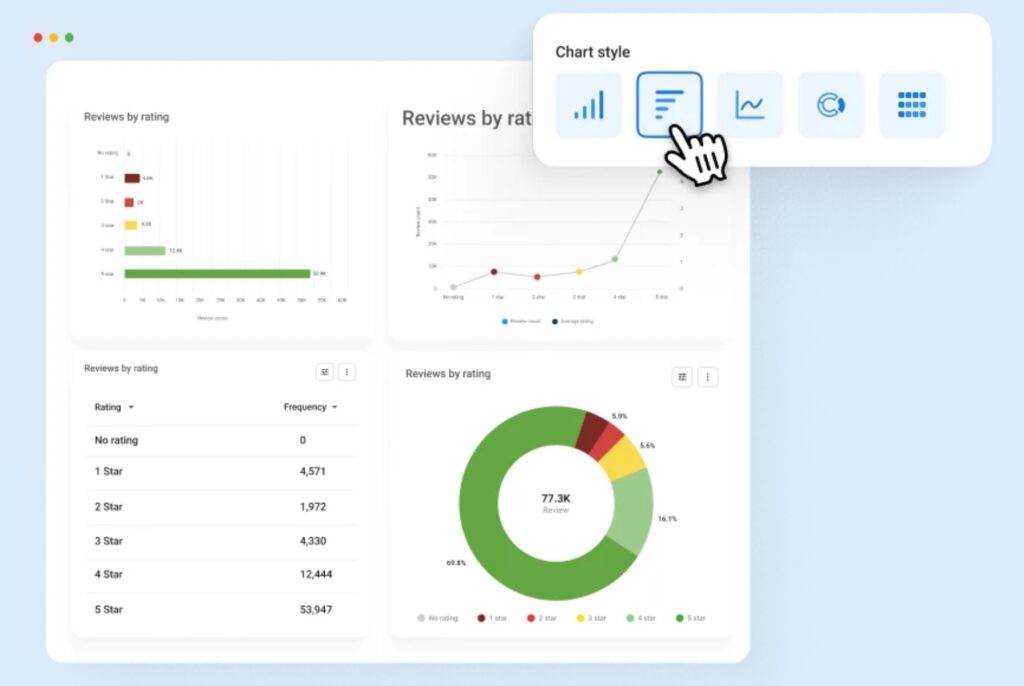
- Powerful reporting & visualization: Transform complex data into easy-to-understand reports and visualizations for clear and actionable insights.
- Make data-driven decisions: Gain the confidence to make strategic decisions based on real customer data, not just guesswork.
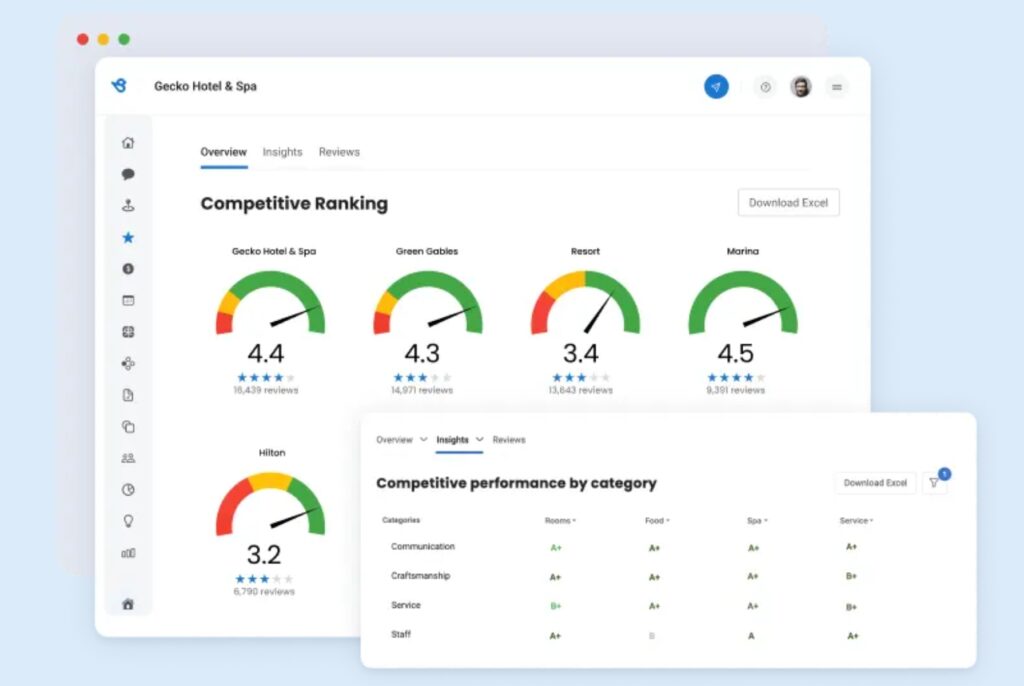
Birdeye Competitive Benchmarking:
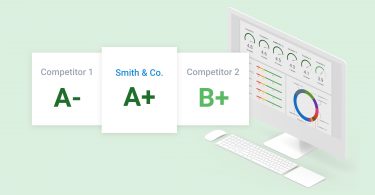
- Know industry benchmarks and compare your performance: Identify areas where you shine and opportunities for improvement.
- Actionable Insights: Gain data-driven insights to refine your marketing strategies and outshine the competition.
- Know your customers inside out: Uncover hidden trends and patterns in customer feedback across reviews, surveys, and social media interactions.
- Sentiment analysis: Understand customer sentiment – what they love and what frustrates them. Use this knowledge to improve customer satisfaction and loyalty.
- Actionable feedback: Turn customer feedback into actionable steps to optimize your operations and exceed customer expectations.
Birdeye goes beyond basic analytics, offering a holistic view of your customer experience.
Schedule a call with our rep who’ll guide you to help you make the most of analytics for your small business.

Originally published


