Are you curious about how people use social media? Are you trying to understand the impact it has on our lives? Social media statistics can provide valuable insights into these questions and more. From Facebook’s total users to Twitter’s average daily tweets, there are so many facts that help us better understand how we interact with social networks.
In this article, we’ll take an in-depth look at over 100 of the most interesting and important social media stats. We’ll explore key trends such as user demographics and advertising across platforms as well as share our first-party data to help you gain insights for your own social media marketing strategy. Let’s get started.
Table of contents
Why social media is essential
Social media is more popular than ever, and billions of people use it to stay connected with friends and family and to get news and information. Here are some interesting social media stats to prove it:
- 59% of the world’s population (nearly 5 billion people) use social media.
- Users spend 2.5 hours on average daily on social media platforms.
- Nearly 60% of marketers believe that social media marketing is a “very important” asset to their overall marketing strategy.
- About 75% of internet users use social media to research businesses and brands.
- 71% of consumers who’ve had positive experiences with brands on social media are more likely to refer them to family and friends.

Birdeye social media statistics
At Birdeye, we pride ourselves on providing the best possible reputation and customer experience service to our customers. Part of that responsibility means making sure that our products meet the highest standards. We recently surveyed our customers to better understand their social media needs. There were hundreds of participants, with company sizes ranging from small market businesses (SMB) to commercial and enterprise. Here are the results. Please note that for some participants, selecting multiple answers applied.
Managing social media activities
Who manages your social media activities will depend on the size and goals of your business. The person or group of people responsible for your company’s social media accounts must be familiar with the platform’s features and functions. They should also understand their audience, stay up to date on trends, and post engaging content that resonates with followers.
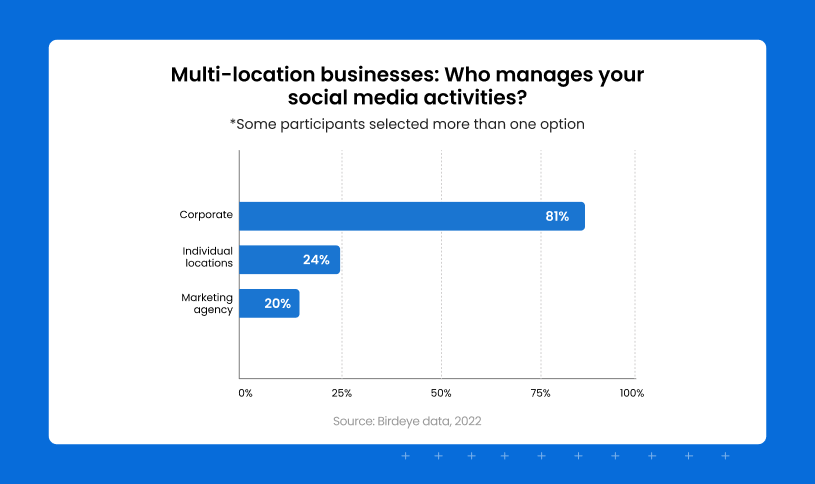
For multi-location businesses, our data tells us that about 81% of participants handle social media on the corporate level, 24% have employees at individual locations, and 20% work with marketing agencies.

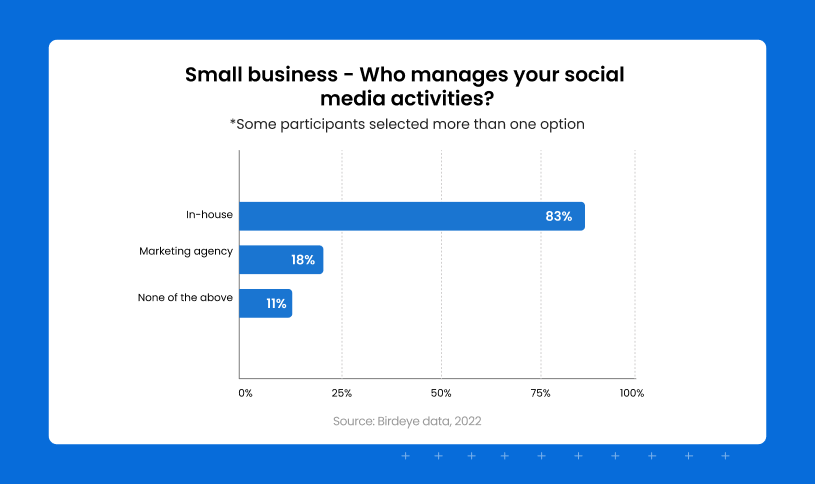
For single-location businesses, most manage social media in-house.

Content creators for multiple locations
The content that you post on your social media accounts says a lot about your brand and its values. You need to create content that is relevant, engaging, and visually appealing. That’s why it’s important that the person you choose to create your social media content is in tune with your goals and objectives.
Our survey found that:
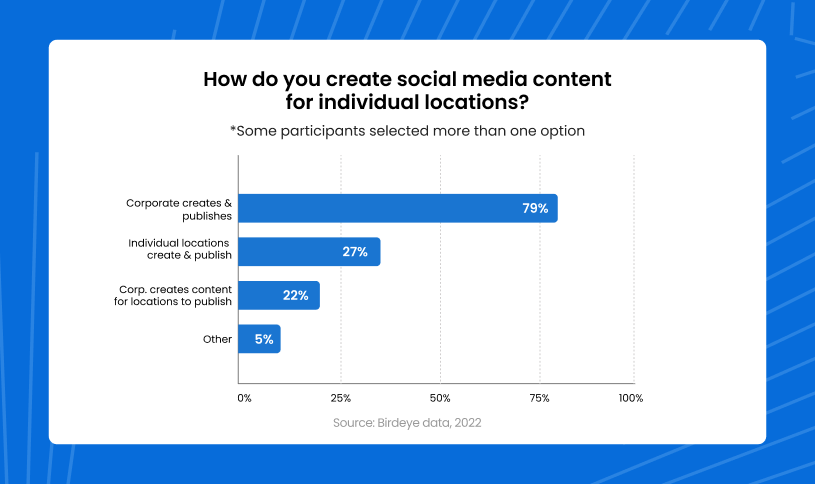
- 79% of businesses get their social media content created and published by their corporate social media team, while
- 27% create content at the location level, and
- 22% take a hybrid approach by creating content at the corporate level that is then shared with each location.

By keeping control of social media content creation, a corporate team can make sure that messaging is on-brand, follows corporate guidelines, and is in line with the overall strategy across all locations.
Popular social media platforms
The social media platforms your company uses should be the ones that your target audience frequents the most. According to our survey:
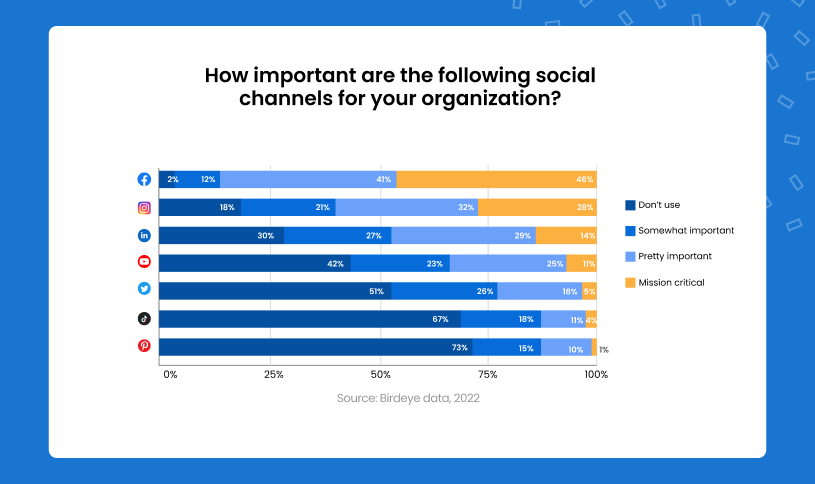
- 87% consider Facebook either pretty important or mission critical, making it the top choice for our customers.
- Instagram came in second place with 60%, followed by LinkedIn (43%), YouTube (36%), and Twitter (23%).

Choosing the right social media platforms for your business can make or break your marketing strategies. Each one offers a distinct user base and capabilities. It’s essential to determine which option best aligns with your objectives. To help you take the guesswork out of the equation, here are some social media statistics from the most popular platforms.
Statistics about social media platforms
Facebook statistics
General stats
- Facebook has 2.9 billion active users worldwide.
- 36.8% of the global population uses Facebook to stay connected.
- Almost all Facebook users (98.3%) access the platform with their mobile devices.
- Facebook turned 18 years old in 2022.
Demographic stats
- 648.6 million people aged 25 to 34 are active Facebook users. This makes up the largest age group on the platform.
- 43.2% of Facebook’s users are female and 56.8% are male.
Marketing stats
- 90% of social media marketers use Facebook to promote their business.
- 1.6 billion users are connected to small businesses on Facebook.
- Facebook advertising revenue last year was $114.93 billion.
To learn how to attract more engagement for your Facebook posts, check out our blog post How to get more Facebook likes: 12 tips that really work.
Instagram statistics
General stats
- Instagram has nearly 1.4 billion monthly users and is the fourth most popular social networking platform in the world.
- This year, the number of Instagram users is expected to increase by 5.47%.
- The U.S. accounts for 170 million Instagram users.
- The Instagram app has been downloaded 3.8 million times.
Demographic stats
- Instagram has over 670 million female users which is 56% of its overall users.
- The majority of Instagram users (71%) fall within the age range of 18 to 24 years old.
Marketing stats
- 71% of U.S. businesses are using Instagram as part of their marketing strategy.
- About 79% of marketers worldwide use Instagram.
- 7 out of 10 users like or don’t mind ads when watching videos on Instagram.
- 90% of users follow at least one company on Instagram.
Need help getting verified on Instagram? Check out our blog post, How to get verified on Instagram with the blue check mark, to make it happen sooner than later.

YouTube statistics
General stats
- As of 2024, there are over 2.7 billion active users on YouTube.
- YouTube is the 2nd ranked social media platform, pulling in 1.7 billion unique users monthly.
- 500 hours of content are uploaded to YouTube every minute.
- There are at least 51 million existing YouTube channels on the platform.
Demographic stats
- 53.9% of YouTube users are male and 46.1% are female.
- In the U.S., 81% of adults use YouTube.
- YouTube is most popular with people between the ages of 25-34 (20.2%).
Marketing stats
- 9 out of 10 consumers find new brands and products on YouTube.
- 84% of people have made a purchase after watching a brand’s YouTube video.
- 52% of marketers use YouTube to promote products and services.
- Users within the age group of 25 to 34 account for the largest share of YouTube’s advertising audience.
Twitter statistics
General stats
- Twitter has 259.4 million daily users.
- 500 million tweets are posted daily.
- People spend about 3.5 minutes on Twitter per session.
- Videos on Twitter can increase emotional engagement by 33%.
- Twitter is the 14th largest social media platform.
Demographic stats
- 20% of U.S. adults use Twitter.
- Twitter is popular with millennials — 38.5% of users are between the ages of 25 and 34, and 20.7% are aged 35 to 49.
- More than 70% of Twitter users are male and 30% are female.
Marketing stats
- Twitter’s global ad revenue reached $6 billion in 2022.
- Twitter ads have the potential to reach 339.6 million people.
- Nearly 80% of Twitter users follow a business or brand.
- The cost-per-click (CPC) for Twitter ads is about $0.38.
TikTok statistics
General stats
- TikTok has 1 billion monthly active users across the globe.
- From 2018 to 2020, TikTok’s U.S. user base increased by 787.86%.
- TikTok users spend an average of 90 minutes daily on the platform.
- TikTok is the #1 downloaded app in over 40 countries.
- The platform has been valued at $50 billion.
Demographic stats
- TikTok’s largest user demographic is the age group of 10-19. This makes up 25% of the U.S. users, followed closely by those aged 20-29 at 22.4%.
- 56.2% of TikTok users are female and 43.8% are male.
- More than half of the creators on TikTok are female (53.79%).
Marketing stats
- TikTok views have an average engagement rate of 6.72%.
- Advertisers can reach about 885 million users 18 and older on TikTok.
- Ads on TikTok start at $10 per 1000 views – $500 minimum per campaign.
- 37% of marketers plan to increase their TikTok use.
Snapchat statistics
General stats
- 375 million people use Snapchat each day.
- Snapchat has a current value of $18.3 billion which is a 79% decline from 2022.
- Snapchat pays over $1 million per day to creators of the highest-performing content.
- Snapchat is the #1 platform for people to post and share real-life moments.
- Snapchatters spend about 30 minutes per day on the platform.
Demographic stats
- 54.4% of Snapchat users are female with 44.6% being male.
- The most popular age groups on Snapchat in the U.S. are 15-25 (48%) and 26-35 (30%).
Marketing stats
- 57% of the posts brands distributed on Snapchat are video ads.
- Snapchat ads can reach 347 million daily active users.
- 39% of Snapchat’s advertising audience is aged 18-24.
- Ads on Snapchat cost $5 per day.
LinkedIn statistics
General stats
- LinkedIn has over 850 million members.
- According to LinkedIn, they are available in over 200 countries.
- The average LinkedIn user spends about 17 minutes a month on the platform.
- 71% of users on LinkedIn have a salary of at least $50,000.
Demographic stats
- About 58% of LinkedIn users are male with females representing 42.8%.
- The age group of 25-34 makes up 59.1% of LinkedIn users.
Marketing stats
- 40% of business-to-business (B2B) marketers agree that LinkedIn is the most effective platform to drive high-quality leads.
- According to marketers, conversion rates on LinkedIn are 2x higher.
- 50% of U.S. marketers use LinkedIn.
- Every week, about 40% of LinkedIn visitors interact with a Page organically.
If you’re looking to get your LinkedIn marketing off the ground faster, read our blog post LinkedIn marketing hacks to grow your business.
Pinterest statistics
General stats
- According to Pinterest, 450 million people use the platform every month.
- It’s the 15th biggest social media platform.
- 85% of users access Pinterest on their mobile app.
- People watch nearly 1 billion videos daily on Pinterest.
- Pinterest has the highest American Consumer Satisfaction (ACSI) score of 76/100.
Demographic stats
- Over 75% of users on Pinterest are female.
- Pinterest users 50-64 years old make up the largest age group on the platform (38%), followed by 30-49 (34%), and 18-29 (32%).
Marketing stats
- Pinterest shoppers spend 2x more a month when compared to other social media platforms.
- 34% of Pinterest users earn between $50,000 and $74,999 annually.
- Pinterest ads have 2.3x greater cost per conversion than ads on other social media platforms.
- By 2026, Pinterest’s ad revenue is expected to reach $4.1 billion.
FAQs about social media statistics
Social media marketing statistics can be an extremely effective resource for businesses. They provide insights into demographics, engagement rates, and more, giving businesses valuable information so they can create strategies that work.
Reports show that nearly 5 billion people use social media around the world as of January 2023. This equates to about 60% of the total global population.
To import social media statistics into Google Sheets, they’ll need to be in a CSV format. Open a new spreadsheet and select File -> Import. Under the ‘Upload’ tab, find the CSV file and click ‘Open’. Finally, click the ‘Import data button’.
1. People spend close to 2.5 hours on social media daily.
2. Nearly 270 million people used social media in the U.S. in 2022.
3. Social media is more popular with U.S. females than males.
4. There are 4.76 billion social media users worldwide.
5. As of January 2023, Facebook is the most used social media platform.
Negative statistics about social media primarily deal with its impact on mental health and how it may affect children.
Bring your social networks together with Birdeye Social
Social media statistics can be an invaluable resource for understanding customer behaviors and creating effective strategies. With Birdeye Social you can bring all your social networks together like Facebook, Instagram, LinkedIn, YouTube, and Twitter so that you can easily track key social media metrics in one place. Watch our free demo and start connecting with followers today.

This blog post is part of our Social Media Management Guide
Originally published


