
Net promoter score is a customer loyalty metric that measures how likely customers are to recommend your business, helping you understand sentiment and predict growth.
Summary
Picture a quick question at checkout: “On a scale of 0 to 10, how likely are you to recommend us?” That single prompt powers the Net Promoter Score, one of the simplest ways to measure loyalty. In 2025, NPS is more than a number. It can serve as a signal light for customer experience, reputation risk, and long-term growth when you track it consistently and act on the feedback it provides. Teams that pair NPS with AI-driven insights can spot patterns faster, fix root issues sooner, and turn passive customers into loyal advocates.
This blog covers how to calculate the net promoter score and interpret what the results really mean. It also explains how companies use NPS feedback to improve experience, build loyalty, and drive sustainable growth.
Loyalty lens 🔍
Think NPS is just a basic scorecard? Not anymore. In 2025, it’s your reliable predictor of business success if used correctly. Companies pairing NPS with AI-fueled insights are turning passive customers into loyal enthusiasts—and transforming feedback into revenue.
Table of contents
- What is Net Promoter Score?
- The three Net Promoter Score responses and what they mean
- Net promoter score example
- How does the Net Promoter Score work?
- Understanding what your Net Promoter Score means
- Net Promoter Score & other modern customer experience metrics
- Birdeye Survey AI: Turn NPS data into customer loyalty wins
- NPS industry benchmarks: What does your score tell about customer loyalty
- Net Promoter Score visualization: How to make your data actionable
- Why NPS alone can mislead your customer experience strategy
- FAQs on Net Promoter Score
- Birdeye helps you act on your Net Promoter Score with speed and clarity
What is Net Promoter Score?
The Net Promoter Score (NPS) is a customer loyalty metric that measures how likely customers will recommend your company to others. Introduced by Fred Reichheld in 2003, NPS has become a widely used tool to capture customer sentiment and gauge the overall health of their customer relationships.
NPS’s simplicity has made it a reliable predictor of loyalty, repeat purchases, and even company growth when used alongside deeper customer insights.
The three Net Promoter Score responses and what they mean
At its core, NPS surveys ask a single key question:
“On a scale of 0 to 10, how likely are you to recommend [Company/Product/Service Name] to a friend or colleague?”
The responses allow businesses to segment customers into promoters (loyal enthusiasts), passives (neutral), and detractors (unsatisfied customers). With this NPS question, businesses can quickly assess customer experience and make informed business decisions by summarizing this feedback into a single score.
Based on their response, these survey respondents are sorted into three categories: Promoter, Detractor, and Passive. Let’s go through all three:
Promoter
A promoter is a customer who rates your business as a 9 or a 10. These customers had a great experience and will likely act like brand evangelists, telling friends and family about visiting your business.
Detractor
A detractor is a customer who rates your business from 0 to 6. These customers were not satisfied with their experience and would not recommend your business. They might even spread negative word-of-mouth and drive potential customers away.
Passive
A passive customer is a customer who rates your business as a 7 or an 8. While these customers might not have a negative view of your business, they’re not likely to actively recommend it to others.
What is a good Net Promoter Score?

A good Net Promoter Score means you have more promoters than detractors. Generally, a score above 0 is positive, while 50 or higher signals strong customer retention and loyalty. Scores of 70+ are considered exceptional and are typically seen in top-performing companies.

Keep in mind that what qualifies as a “good” NPS can vary by industry.
How to calculate Net Promoter Score?
To calculate the Net Promoter Score, you first gather responses to the standard NPS survey question. Then, categorize customers into three groups based on their ratings:
- Promoters (9-10): Enthusiastic advocates who are highly likely to recommend your business and fuel growth.
- Passives (7-8): Satisfied but unenthusiastic customers vulnerable to competitive offerings.
- Detractors (0-6): Unhappy customers who could share negative word of mouth and impede growth.
Net promoter score calculation
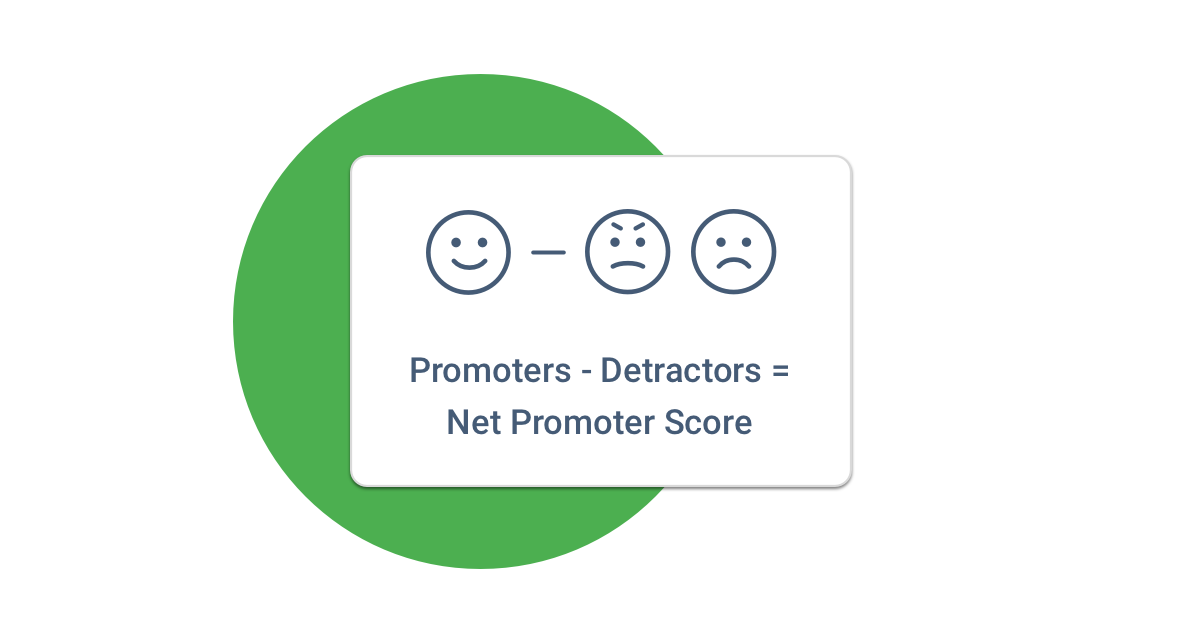
The Net promoter score calculation is a simple formula:
NPS score = % of Promoters – % of Detractors
Net promoter score example
Let’s say you conduct a NPS brand survey, and the results show that 70% of respondents are Promoters, 20% are Passives, and 10% are Detractors.
To calculate your Net Promoter Score (NPS), use the formula:
𝑁𝑃𝑆 = % of Promoters−% of Detractors
Substituting the values: 𝑁𝑃𝑆= 70% − 10% = 60%
So, your NPS score would be 60 — indicating a strong customer loyalty level.
This way, many businesses use NPS surveys to track performance regularly, comparing their results against industry benchmarks or their company’s NPS over time.
With the basics and calculations covered, let’s now dive into how the Net Promoter Score works as a system and how it fuels customer insights.
How does the Net Promoter Score work?
The Net Promoter Score system is more than just a number—it’s a process for collecting, analyzing, and acting on customer feedback. The key lies in asking the right NPS question.
Here’s how it works:
Collect feedback through NPS surveys
Start by distributing NPS surveys across multiple touchpoints in your customer journey—email, SMS, or post-purchase follow-ups. Multi-location businesses often embed these surveys into their existing customer experience platforms.
Segment your customers
Based on their responses, customers are grouped into promoters, passives, or detractors. These segments help businesses focus their strategies, whether improving service for passive customers or resolving issues with unenthusiastic customers.
Know How Much Your Customers Recommend You Through Net Promoter Score
Want to see the impact of Birdeye on your business? Watch the Free Demo Now.
Analyze NPS data
Companies don’t stop at the score—they dig into NPS feedback to identify trends, patterns, and root causes. For instance, are detractors consistently unhappy about long wait times or product quality?
Take action to improve customer satisfaction
Turning NPS into impact means taking action—whether that’s addressing operational bottlenecks or creating loyalty programs to nurture enthusiastic customers.
Net Promoter Score surveys are just the starting point. The magic happens when you apply NPS insights to improve customer experience and influence business success.
Once you have your score and insights, the next step is to understand what that number actually means for your business—let’s decode the NPS interpretation next.
Understanding what your Net Promoter Score means
An NPS score can range from -100 to +100—but what does that number tell you? Interpreting Net Promoter Score results depends on your industry, customer base, and how your score compares to industry benchmarks.
Here’s how to interpret Net Promoter Score:
- Negative scores (below 0): A warning sign of poor customer satisfaction survey and growing customer churn risk. Negative scores mean you have more detractors than promoters, and your brand could be exposed to negative word of mouth.
- 0 to +30: This is considered an average score, depending on your sector. Many multi-location businesses in retail and hospitality typically fall into this range.
- 30 to +70: A strong score that indicates healthy customer relationships, high customer loyalty, and the likelihood of repeat purchases.
- 70+: A world-class score suggests you have a base of loyal and enthusiastic customers who actively recommend your brand, fueling business growth and revenue growth.
Net Promoter Score tip: Always interpret your overall NPS score relative to your industry average and competitors’ performance. For example, the NPS scale for eCommerce may differ from that of SaaS or healthcare industries.
More importantly, NPS interpretation isn’t just about numbers—it’s about uncovering actionable insights to improve the customer experience and reduce friction across the customer journey.
But interpreting your score is just the beginning. The next step is understanding how it fits within the broader ecosystem of customer experience metrics.
Net Promoter Score & other modern customer experience metrics
The Net Promoter Score remains a trusted signal of customer loyalty, helping businesses identify brand advocates and detractors. Yet, in 2025, relying on NPS alone is no longer enough. While NPS is a great starting point that tells you who will likely recommend your business, it doesn’t explain why a customer felt that way or how easy their journey was.
This is where metrics like Customer Satisfaction (CSAT) and Customer Effort Score (CES) complement NPS.
While CSAT captures customers' satisfaction after a specific touchpoint, CES highlights how smooth or difficult that interaction was. On the other hand, NPS provides a broader picture of long-term loyalty, but it often lacks context about specific experiences.
That’s why today’s leading businesses pair NPS surveys with other feedback loops, combining multiple signals to guide operational improvements. A healthy NPS might hide areas where customer expectations aren’t being met.
The best customer-centric brands integrate NPS into an omnichannel approach—capturing feedback across the full customer journey, from first interaction to repeat purchases.
For multi-location brands, that “first interaction” often happens before a customer ever speaks to your team. It happens on Google, Apple Business Connect, and Yelp, where customers check hours, locations, and links. If that information is inconsistent, customers start their journey with friction, and your NPS score can take the hit.
That is why Birdeye Listings AI agents focus on keeping every location visible, accurate, and optimized for local discovery. The agents continuously monitor your brand footprint, flag missing attributes or broken links, and close the gaps that dilute local search authority. As the agents use Local Intelligence, they also identify market-level opportunities, including the keywords and profile updates that help each location show up in the searches that actually drive visits.
But it’s not just about which metrics you use—how you operationalize them. That’s why many customer-centric brands leverage solutions like Birdeye, an all-in-one customer experience platform that includes Net Promoter Score tracking, to unify these metrics into a single dashboard.
Let’s take a closer look at how it works.
Our customers, their stories:

Problem = 60+ locations with an average of 20-30 reviews per location per month - so Birdeye has allowed us to centralize monitoring and survey reporting on patient satisfaction and NPS. Benefits are that we more quickly respond to patient feedback, and we've been able to improve our NPS by using Birdeye data to highlight locations that have opportunities for improvement in patient experience.

 - Timothy Surowiecki from Sono Bello
Birdeye Survey AI: Turn NPS data into customer loyalty wins
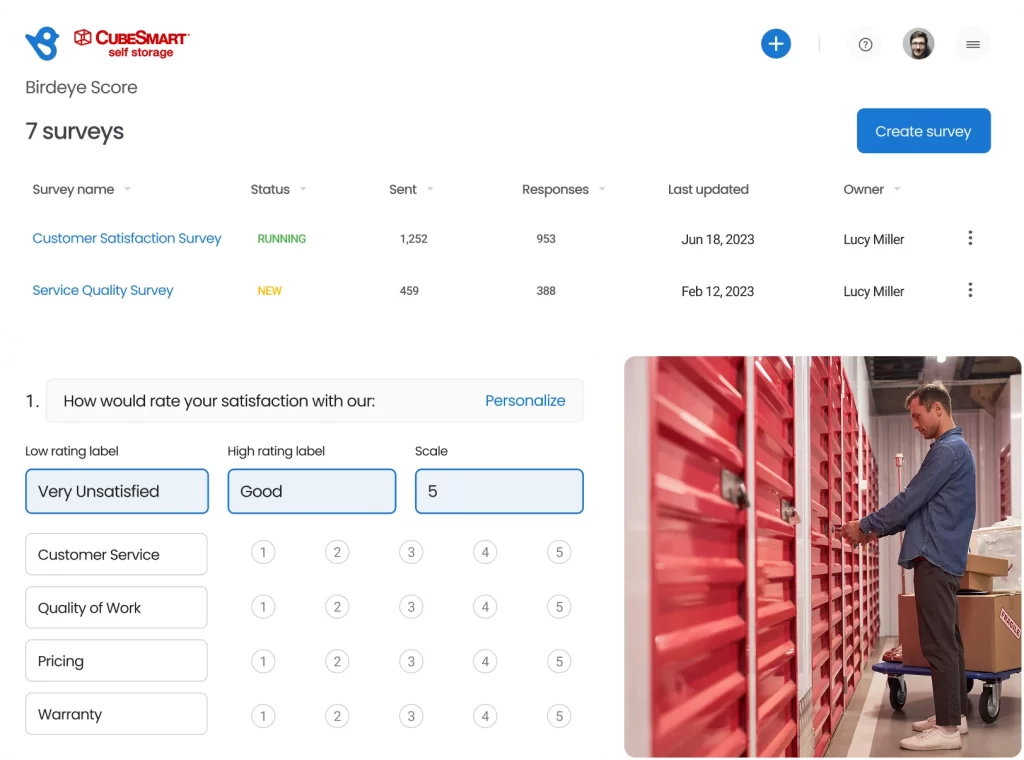
With Birdeye’s survey builder, NPS becomes more than a number—part of an agile, data-driven customer experience strategy. Here’s why Birdeye stands out:
- Automated NPS survey campaigns via text and email.
- AI summaries that cut through the noise to reveal key takeaways.
- Sentiment Score to track customer emotion alongside NPS metrics.
- Visual dashboards for reporting and location-based insights.
- Ticketing and alerts to follow up on detractor feedback fast.

Now that you know how this NPS software helps you, let’s understand some industry benchmarks and what your real score reveals about your customers.
NPS industry benchmarks: What does your score tell about customer loyalty
The Net Promoter Score definition is simple—it’s a core part of the net promoter system, a framework used to measure Net Promoter Score and capture how loyal your existing customers are compared to new customers or prospects. However, what qualifies as a good NPS score depends heavily on your industry.
The typical NPS calculation is based on subtracting detractors from promoters, but behind this simple equation lies years of customer relationship data.
📊 Here’s a snapshot of average NPS scores across key industries in 2025:
- Retail and ecommerce: The industry average hovers around 40-50, though brands with strong omnichannel strategies often push their NPS into 70+.
- Financial services and mortgage companies: These companies usually aim for an NPS between 30-45, with relationship-building driving NPS measures.
- Home services and property management: Scores average between 20-40, but the best performers exceed 60+, largely due to better handling of NPS feedback from existing customers.
Why do NPS benchmarks matter?
Comparing your overall NPS score to industry benchmarks gives you a complete picture of how well your net promoter system functions. For example, consistently lower scores than your industry peers may indicate issues with your customer journey or employee Net Promoter Score that could affect overall sentiment.
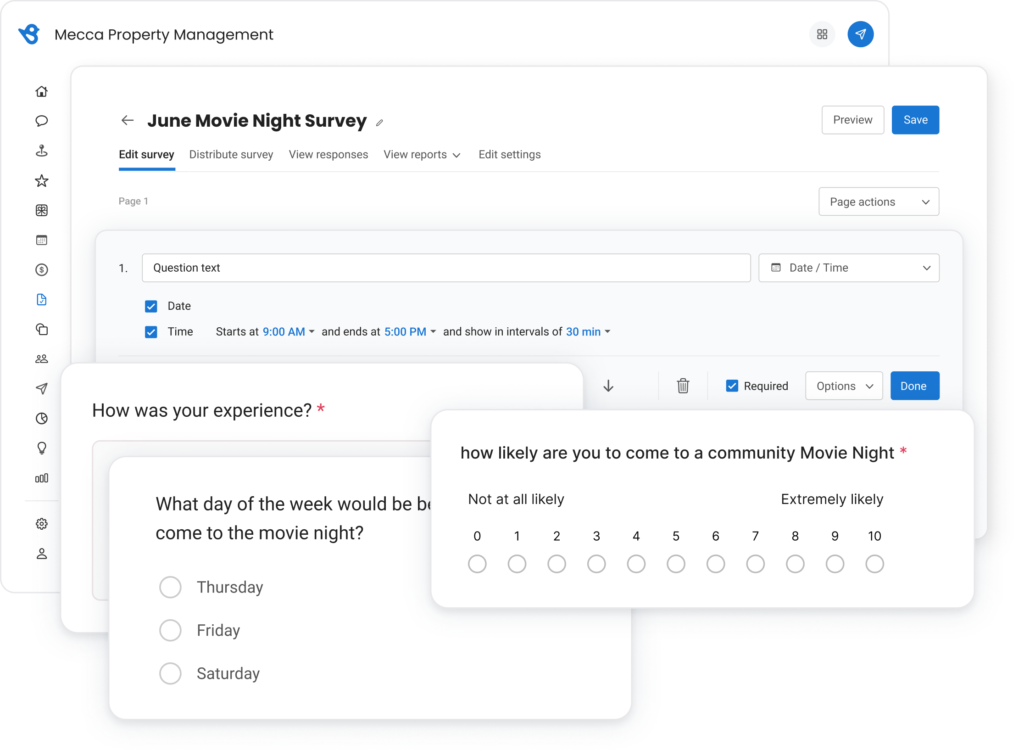
A great example is Mecca Property Management, which used Birdeye’s platform to monitor and improve its NPS score directly. With Birdeye, Mecca increased their Net Promoter Score by 21 points (a notable 54% increase in NPS promoters) in just 6 months.

Automating NPS surveys, reducing friction in service delivery, and addressing feedback trends helped Mecca raise its score and improve the experience for both new and existing customers.
Fun fact: Some brands even use NPS-related emoticons in surveys to simplify customer scoring across digital touchpoints. While traditional scores still dominate, modern teams apply creative approaches to the net promoter score system to engage diverse audiences.
Now that you know where your score stands, the next challenge is making your NPS data informative and actionable. Let’s explore how visualization helps teams turn numbers into strategy.
Net Promoter Score visualization: How to make your data actionable
Calculating your Net Promoter Score (NPS) is just the beginning—turning that score into strategy is where the real value lies. This is why net promoter score visualization has become critical for businesses aiming to deliver world-class customer experience and drive business success.
Even with strong visuals, brands must be mindful of common pitfalls in interpreting and acting on NPS data. Here’s how businesses visualize NPS data effectively:
- Dashboards that show trends, not just scores
Brands today use real-time dashboards that visualize NPS feedback trends across the customer journey. For example, heatmaps may show service bottlenecks, or survey responses highlight specific stages where detractors spike. - AI-enhanced NPS insights
Companies increasingly layer GenAI tools into their NPS data analysis to detect emerging patterns. Passive customers flag longer wait times, or enthusiastic customers recommend specific product lines. - Segmented reporting for business teams
Customer experience, marketing, and operations teams need different views. Visualizing NPS allows businesses to filter insights by location, department, or customer segment, giving each team an actionable view.
How Kona Cleaners turned NPS data into operational wins with Birdeye
Kona Cleaners, a family-owned dry-cleaning brand with 18 locations, adopted Birdeye to streamline customer feedback by automating NPS surveys and visualizing customer trends.
Before Birdeye, the team struggled to track NPS results consistently, often relying on manual follow-ups. After implementing Birdeye Surveys AI’s automated system and real-time dashboards, Kona’s team could promptly identify and promptly respond to customer pain points.
The result? A 15% increase in promoter scores, a sharp reduction in negative customer feedback, and improved operational efficiency across all 18 stores.

Their leadership also cited how visualizing customer trends helped them coach store-level teams to address service issues faster, resulting in better customer sentiment and a noticeable uptick in repeat purchases from loyal customers.
Without proper visualization, NPS measures risk becoming just another metric. However, as Kona Cleaners discovered, when paired with automation and real-time insights, NPS drives customer satisfaction, employee accountability, and company growth.
While visualization helps turn data into action, relying solely on NPS can have limitations. Let’s explore where NPS may fall short and how businesses can avoid common pitfalls.
Why NPS alone can mislead your customer experience strategy
While the Net Promoter Score is a powerful tool for measuring customer loyalty, it has limitations. Many businesses fall into common traps when relying too heavily on NPS alone—creating gaps in their omnichannel customer experience strategy.
1. Overlooking qualitative feedback
One major blind spot is focusing solely on the score and ignoring the actual comments in product survey responses. An NPS of +50 may look solid, but if detractors raise issues in their open-ended feedback and your team isn’t acting on it, the metric offers a false sense of security.
2. Treating NPS as a one-size-fits-all metric
Different industries require different benchmarks, yet some businesses apply universal expectations. For example, in healthcare, a good NPS score might be +50, but in eCommerce or SaaS, expectations may skew higher. Relying only on general averages without adjusting for customer expectations can skew decision-making.
3. Ignoring internal drivers of low scores
Low NPS results often reflect internal factors like poor service delivery, understaffed teams, or weak follow-up systems. VanDyk Mortgage, for instance, realized that before using Birdeye, slower follow-ups contributed to lower satisfaction levels across key customer journeys.
4. NPS doesn’t explain the “why” behind customer behavior
NPS data gives you a “what” but not always a “why.” For example, while VanDyk Mortgage consistently collected NPS surveys, their team struggled to connect detractor feedback to specific moments in the loan approval process.
How VanDyk Mortgage boosted customer responsiveness and NPS insights with Birdeye
VanDyk Mortgage lacked a centralized system to manage NPS surveys and customer feedback across its branches. Manual follow-ups were slow, resulting in missed opportunities to address detractor feedback and inconsistent customer sentiment across locations.
That is when they selected Birdeye to automate NPS surveys and reviews. This gives branch managers real-time dashboards to quickly resolve customer issues and improve the customer journey.
The results:
With Birdeye, VanDyk Mortgage streamlined feedback collection and follow-ups, leading to faster issue resolution, improved NPS scores across key service stages, and increased promoter scores across its branch network. The team gained actionable insights that helped strengthen overall customer satisfaction and brand trust.

FAQs on Net Promoter Score
Yes, Net Promoter Score SM and Net Promoter System SM are registered trademarks of Bain & Company, Fred Reichheld, and Satmetrix Systems, Inc.
NICE Systems is a technology company known for customer experience and engagement solutions, but it is not the creator of NPS. Bain & Company and Satmetrix co-developed the Net Promoter Score.
NPS Prism is a benchmarking tool created by Bain & Company that helps businesses compare their Net Promoter Scores to industry peers, offering deeper insights into how their brand stacks up against competitors.
NPS helps businesses drive growth by identifying promoters who are likely to recommend your company and detractors who may spread negative word of mouth. This allows you to take corrective action and improve customer relationships.
The best NPS software should offer automated survey campaigns, AI-powered feedback analysis, and real-time dashboards, like those available in Birdeye Survey AI.
Birdeye helps you act on your Net Promoter Score with speed and clarity
Collecting your Net Promoter Score is just the first step. Turning that number into better customer experiences—and, ultimately, business success—requires the right platform to make feedback actionable. That’s where Birdeye Survey AI stands out.
Moreover, NPS tells you how customers feel, but your listings often shape what they feel in the first place. When customers find the wrong address, outdated hours, or incomplete services online, they arrive annoyed, and that frustration shows up in feedback. Birdeye Listings AI agents help prevent that by turning listings management into a governed, enterprise-ready workflow.
They monitor your core profiles 24/7, recommend high-impact improvements like localized Q&As and fresh photos, and generate brand-aligned descriptions that support AEO readiness. Just as important, they run with enterprise guardrails, so you can use approval workflows that match your team’s comfort level.
The result is one source of truth across listings, reviews, and customer signals, so each location stays accurate, discoverable, and easier to choose.

Whether you’re aiming to reduce churn, improve customer satisfaction, or turn your promoters into loyal brand advocates, Birdeye makes your Net Promoter Score system part of a smarter, data-driven customer experience strategy.

About the Author
Shruti Dugar
Birdeye
Originally published